Learn about the Z axis for charts in PowerPoint. The Z axis is also known as the depth axis or the series axis.
Author: Geetesh Bajaj
Product/Version: PowerPoint
OS: Microsoft Windows and Mac OS X
The Z axis is the Depth axis that some 3D charts contain. Sometimes, this third axis is also called the Series axis. Let us be clear about the fact that not all 3D charts contain a Z axis. In fact, some 3D chart variants use the third dimension even if they do not need a Z axis! They do so because some people believe that 3D is so cool. Truth be said, 3D charts come with their own share of problems (explore our Problems with 3D Charts article).
You really must not create 3D charts if a Z axis is not required for your data. As Nancy Duarte says in her HBR Guide to Persuasive Presentations book:
If you don't have a Z axis in your data, omit 3D effects, the depth can make your numbers look larger than they are.
So essentially, try and follow these guidelines:
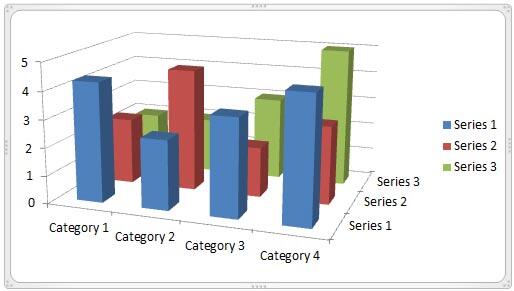
Let's imagine that you must have a 3D chart with a Z axis, as shown in Figure 1, below.

Figure 1: Chart with Z axis
So how do you play with this axis? What are the options you can set for this axis? The answer to these questions may differ from chart to chart but broadly speaking, the Z axis is just another axis and all options we have explored for other axis elements hold good for the Z axis as well. Here are links to some axis tutorials on Indezine:
Chart Axes
Axis Titles
Changing Axis Labels
Reposition and Hide Axis Labels
Tick Marks on Chart Axes
Even after you use a Z axis equipped 3D chart, there may be some challenges to cope up with:
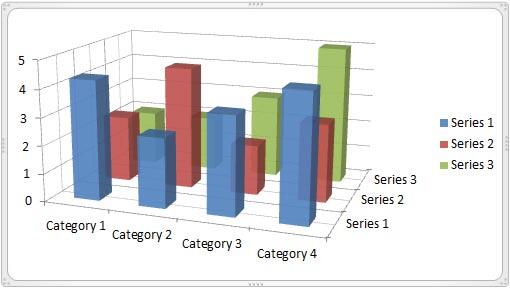
First of all the columns at the back may not be too visible, or in case the values for that column may be so low that it might be hidden by the column in the front. You can make your 3D columns transparent, as shown in Figure 2, below. This may only be a workaround solution, so although changing transparency may work sometimes, it may not do the trick for all 3D charts.

Figure 2: Chart with transparent 3D columns
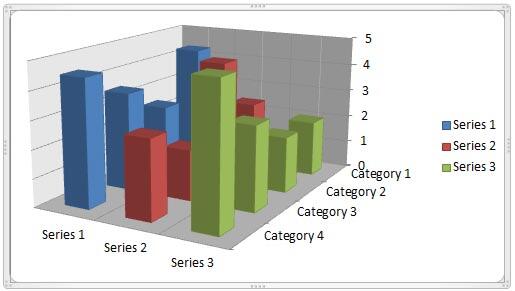
Alternatively, you can rotate the 3D chart until all columns are visible, as shown in Figure 3, below (compare Figures 1 and 3).

Figure 3: 3D chart rotated to make all columns visible
You can also format walls and floor of a chart that contains a Z axis (see Figure 3, above).
10 10 01 - 3D Charts: Z Axis in PowerPoint Charts: Pros and Cons (Glossary Page)
You May Also Like: Obama Gets Back on Message | Fine Arts PowerPoint Templates


Microsoft and the Office logo are trademarks or registered trademarks of Microsoft Corporation in the United States and/or other countries.