Indezine Logo


Switch Series and Categories in PowerPoint 2013 for Windows

Learn how to switch data between your series and categories in PowerPoint 2013 for Windows. This option can help you swap data easily, without having to start creating a chart all over again.


Author:

Product/Version: PowerPoint 2013 for Windows

OS: Microsoft Windows 7 and higher


Learn PowerPoint

A quiz question has custom Show answers in PowerPoint


A typical column chart contains two sets of data. One set shows as the series within your charts, and the other set ends up representing the categories. By default, the series shows up as the Legend (and columns) within the chart. Categories on the other hand constitute the groups of these individual columns.

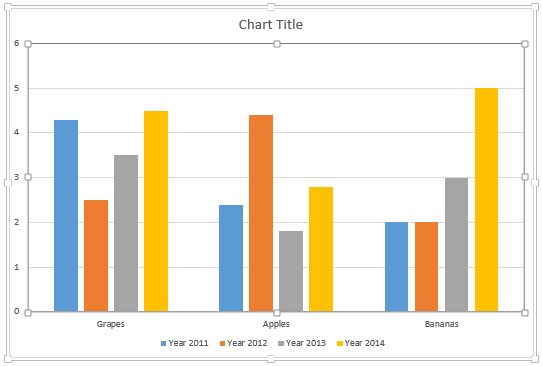
In our sample chart in PowerPoint that you can see in Figure 1, below, the individual fruits (Grapes, Apples, and Bananas) are the series whereas the years (Year 2011, Year 2012, Year 2013, and Year 2014) constitute the categories.
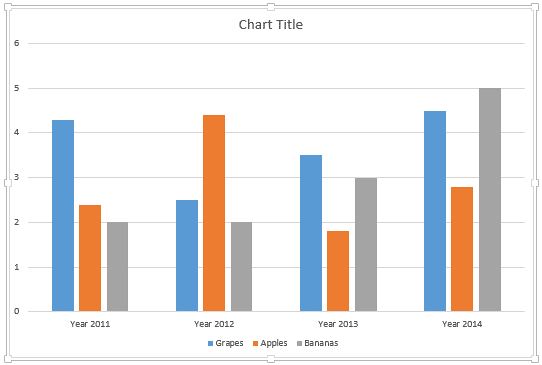
Chart with three Series and four Categories selected
Figure 1: Chart with three series and four categories selected

You can quickly swap the visual representation of series and categories in the chart. For example, our chart currently includes three series and four categories. We can change it to show four series and three categories, as shown in Figure 3, later on this page.

The Data is Saved in Excel

All data that works behind the scenes for any chart in PowerPoint 2013 is essentially stored in an Excel sheet. If you want to explore this data, bring up the Excel sheet that contains the data. This process is explained in our Edit Chart Data in PowerPoint 2013 tutorial. Within this Excel sheet, your data will show up in rows and columns. One of these ends up as categories for your PowerPoint chart and the other reflects as the series. There is no fixed rule about whether a row or column has to be either resulting in a category or a series. This relation can be easily switched all the time. Even though this relation is switched, it won't affect the position of actual data within the Excel sheet.

Follow these steps to swap series and categories for a chart in PowerPoint 2013 for Windows:
  1. Select the chart that you want to swap series and categories for. If you don't have an existing chart, insert a new chart in your slide. For this tutorial we have selected a column chart, as shown in Figure 1, previously on this page.
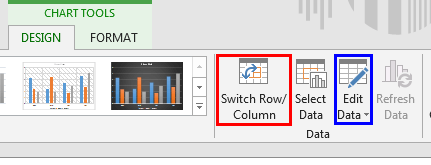
  2. With the chart still selected, access the Chart Tools Design tab of the Ribbon and make sure the Switch Row/Column button is active, as shown highlighted in red within Figure 2.
  3. Switch Row/Column button
    Figure 2: Switch Row/Column button
  4. Why Can't I Click the Switch Plot Button?

  5. Is the Switch Row/Column button grayed out? This indicates that the Excel sheet containing the chart data is not open. To open the Excel sheet containing the chart data, just click the Edit Data button (highlighted in blue within Figure 2, above). Doing so opens the Excel sheet containing the chart data. Now, come back to PowerPoint, and you will see that the Switch Row/Column button is no longer grayed out.
  6. To switch rows and columns of your chart, click the Switch Row/Column button. Doing so will modify your chart by switching the categories and series, as shown in Figure 3 (compare Figures 1 and 3).
  7. Chart rows and columns interchanged
    Figure 3: Chart rows and columns interchanged
  8. Don't See Numbers as Numbers (See Them as Text)

  9. If your chart's category names contain just numbers and no alphabets, then the switching process may not work for you. For example, if we remove the word 'Year' from our sample chart's category names, then clicking the Switch Row/Column button will not achieve the desired result. That's because the charting engine treats those cells as numbers and uses them to populate series values and categories. So, if you want to switch rows and columns, make sure that your chart's Category names are formatted as Text. Learn more in our Format Cells As Text in Excel 2013 tutorial.
  10. If you want the chart to get back to its original status, click the Switch Row/Column button again that you saw in Figure 2 earlier on this page.
  11. Save your presentation often.

See Also:

Chart Data: Switch Series and Categories (Glossary Page)

Switch Series and Categories in PowerPoint 2011 for Mac

You May Also Like: Animate Bubble Charts in PowerPoint with Morph | Environment PowerPoint Templates


Popular Posts

Add Headers and Footers to Slides in PowerPoint 2016 for Windows
Learn how to add Headers and Footers to slides in PowerPoint 2016 for Windows.

Text Box Autofit Options in PowerPoint 2016 for Windows
Learn about Text Box autofit options in PowerPoint 2016.

Paste in Place in PowerPoint
How can you place a copied or duplicated slide object right on top of the original object in PowerPoint?

Formatting Arrows (Arrowheads) in PowerPoint 2013 for Windows
Learn how to format arrowheads for lines in PowerPoint 2013 for Windows.


Organic Shapes with Brush Edges

You get 8 shape types plus lines as part of this Organic Shapes collection. Each of these 8 shape types have 10 variants. So you end up with 80 hand-drawn shape options! Again each of these 80 shapes have 12 brush stroke styles! Plus you get the lines and arrows in 12 brush stroke styles too. Combine all variations to end up with more than 3000 possibilities.

Buy and Download for $99+ (83 MB)


Microsoft and the Office logo are trademarks or registered trademarks of Microsoft Corporation in the United States and/or other countries.

Home | PowerPoint | Photoshop | PowerPoint Templates | PowerPoint Tutorials | Blog | Notes | Ezine | Media Kit | Feedback | Site Map | About Us | Contact Us

Link to Us | Privacy | Testimonials

PowerPoint Backgrounds | Christian PowerPoint Backgrounds | Business PowerPoint Presentation Templates

Plagiarism will be detected by Copyscape

©2000-2023, . All rights reserved.