The Chart Area is essentially populated with various chart elements. In other words, the entire chart is contained within the Chart area. When you insert a chart, the position of the Chart Area on the slide depends upon the layout of the slide. If your slide layout is Blank, then the Chart Area is located at the center of the slide. If the chart is inserted within an existing placeholder on the slide, it occupies the entire placeholder. To reposition the Chart on the slide, you can either just select and drag it to the new position on the slide, or reposition it accurately as explained in this tutorial. This tutorial will also teach you how to add alternative, supporting text to the chart to help people with visual disabilities.
Follow these steps to explore more in PowerPoint 2013 for Windows:
- Select the chart that you want to format the Chart Area for. If you don't have an existing chart, insert a new chart in your slide.
- Now, carefully right-click the Chart Area. From the resultant context menu, select the Format Chart Area option, highlighted in red within Figure 1. If you do not get the Format Chart Area option in the contextual menu, you may have right-clicked on an individual chart element. Make sure you then deselect anything in the chart, and then right-click on the edge of the Chart Area.
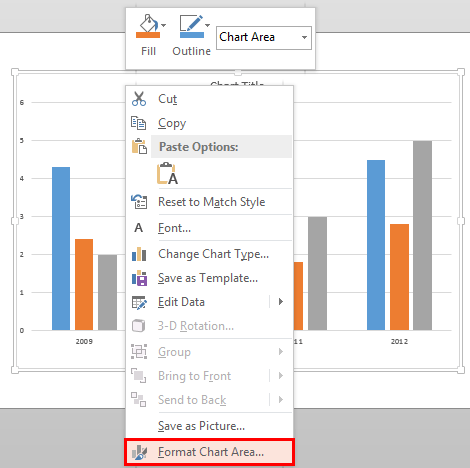
Figure 1: Format Chart Area option - Doing so opens the Format Chart Area Task Pane as shown in Figure 2. In this Task Pane, make sure that the Chart Options tab is selected (highlighted in red within Figure 2). Then click the Size & Properties button (highlighted in blue within Figure 2).
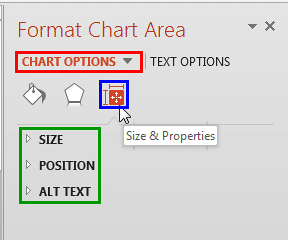
Figure 2: Format Chart Area Task Pane - This will access the Size & Properties options for the Chart Area (highlighted in green within Figure 2). Let us explore these options in the order they appear:
Size
- Click here to access all options within this section, as shown in Figure 3.
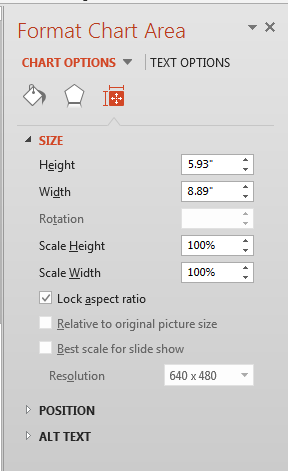
Figure 3: Size options for the Chart Area - As the name suggests, options within the Size section are used to resize the Chart Area. Here, you can directly type the required Height and Width of the Chart area within the boxes provided. You can also scale the height and width attributes of the Chart Area using Scale Height and Scale Width options in percentages (see Figure 3).
- Make sure that Lock aspect ratio check-box is selected if you want the height and width of the Chart area to be resized proportionate to each other.
Position
- This option helps you to reposition your chart on the slide accurately. Click to access the options that you see in Figure 4.
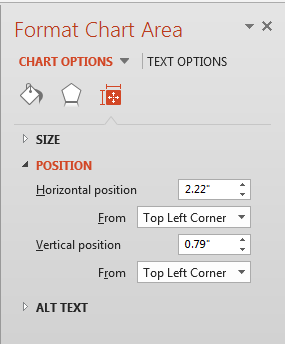
Figure 4: Position options for the Chart Area - The Horizontal position and Vertical position options let you alter the corresponding horizontal and vertical positions of the selected Chart Area (chart).
Horizontal position
- Type in a numeric value or click the up/down arrows to change the horizontal positioning of a Chart Area.
Vertical position
- Type in a numeric value or click the up/down arrows to change the vertical positioning of a Chart Area.
- The zero point for a Chart Area is always calculated from either of two anchor points within the slide, as shown within the From drop-down lists. Each of these drop-down lists have two similar options, as shown in Figure 5.
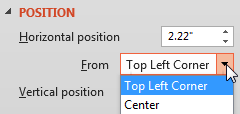
Figure 5: Options within the From drop-down list - If you make no choices, then by default all values are calculated from the Top Left Corner of the slide but you can also choose to position from the Center of the slide, which you can see in Figure 5 as the second option within the From drop-down list.
Alt Text
- Alt Text option is used to enter the alternative text for your chart. Alt Text helps the people who have visual accessibility issues. Select to access the options that you see in Figure 6.
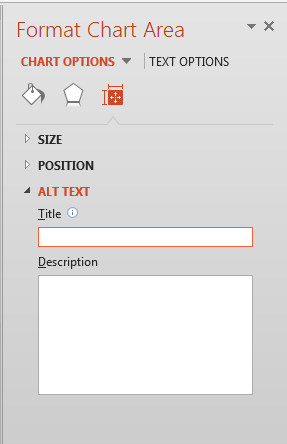
Figure 6: Alt Text options for the Chart Area - Add a suitable Title and Description to the Chart Area (the chart itself).
- Save your presentation often.


