Table borders in PowerPoint sport the default color from the Theme applied to the presentation. However, you can override and change this color as required. Not only you can set the table border color for the new tables before they are drawn, but also you can change the color of existing table borders. Follow these steps to learn more:
Change the Color of Existing Table Borders:
Let us start with changing the table border colors for existing tables:
- Open your presentation in PowerPoint 2013 for Windows and select the table. Make sure that the borders within this table are set to be visible. Access the Table Tools Design contextual tab (highlighted in red within Figure 1) of the Ribbon. Within this tab, click the Pen Color button (highlighted in blue within Figure 1).
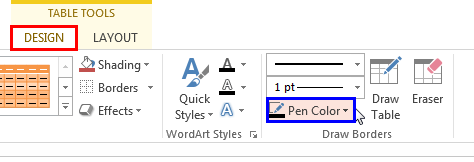
Figure 1: Pen Color button - Doing so opens the Pen Color drop-down gallery, as shown in Figure 2.
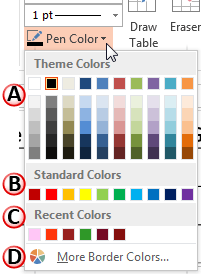
Figure 2: Pen Color drop-down gallery - The options within the Pen Color drop-down gallery are explained below, as marked in Figure 2, above. You'll need to choose any one of these options for the table border:
A. Theme Colors
- Here you can select any of the colors which are from the active Theme of the presentation. You can also select any of the 5 tints or shades for any Theme color. Learn more about Themes here.
B. Standard Colors
- Here you can choose from any of the ten standard colors. These ten standard colors are just choices of colors that PowerPoint believes to be widely used. You don't have to limit yourself to either the Theme colors or Standard colors, as you'll learn in the next options, although it's a good design idea to use Theme colors as far as possible.
C. Recent Colors
- Here you can find the colors most recently used. If you have just launched PowerPoint and created a new presentation, the Recent Colors option may be entirely absent since you haven't selected any color recently!
D. More Border Colors
- This option is to summon the Colors dialog box as shown in Figure 3. This dialog box has two tabs: Standard and Custom. First select the Standard tab (again, refer to Figure 3).

Figure 3: Standard tab within the Colors dialog box - The Standard tab offers 127 colors in a honeycomb style palette, 14 gray shades, black, and white. You can even change the transparency value of the selected color in the Transparency slider below. If you want more color choices, then select the Custom tab of the same dialog box, as shown in Figure 4.

Figure 4: Custom tab within the Colors dialog box - Within the Custom tab, you can choose any color from the spectrum and later adjust the selected color's luminosity with the slider on the right. You can even enter specific values of RGB and HSL to create a specific color. All these combinations provide 16 million color choices!
- Again, you can even change the transparency value of the selected color in the Transparency slider below.
- Choose any color and click the OK button to apply it.
- If the Draw Table button (highlighted in red within Figure 5) does not get selected automatically, do select it now. Your cursor should change to a Pencil icon as shown in Figure 5 (highlighted in blue). Also, you should be able to see your selected color within the Pen Color section, as shown highlighted in green within Figure 5. Click this cursor carefully on a segment of the border between two cells (refer to
Figure 5 again).
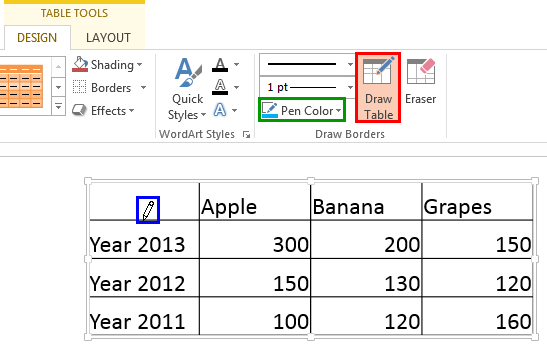
Figure 5: Cursor changed to a Pencil icon
Note: Make sure you do not click anywhere other than over a table border segment. Otherwise you may end up creating new cells! If new cells are created, press Ctrl + Z to undo immediately.
- This will change the color of the border segment to the color that you selected earlier within the Pen Color drop-down gallery, as shown in Figure 6 (compare with Figure 5).
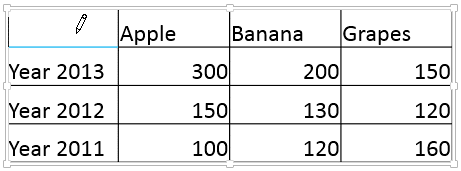
Figure 6: Border color changed - Notice that your mouse cursor will continue sporting the Pencil icon. This allows you to continue clicking on all the border segments of the table. Yes, we know this can be cumbersome. Unfortunately that's what you have to do with existing table borders. We do explain a workaround in the box below.
- Tip: There is an alternative way to change the color of the borders on the entire table. After you select any color within the Pen Color drop-down gallery, click on the down-arrow beside the Borders button (highlighted in red within Figure 7). From the resultant drop-down gallery, select the All Borders option as shown in Figure 7. Yes, you should choose this option again even if this is the option that is already selected.
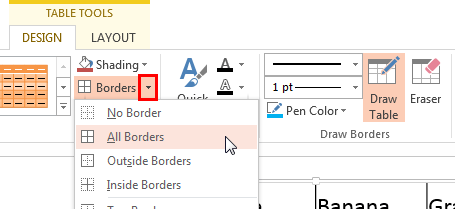
Figure 7: All Borders option to be selected - This changes the color of table borders on the entire table. To learn more about various Border options, refer to our Toggle Visibility of Table Borders in PowerPoint 2013 for Windows tutorial.
- Once done, click on the Slide Area outside the table (or just press the Esc key) to change the cursor back to the arrow pointer icon.
- Figure 8 shows our sample table with changed border colors.
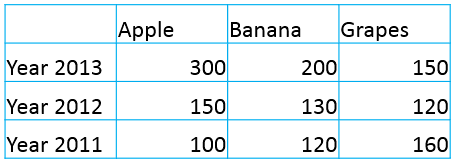
Figure 8: Border color changed for the entire table
Set the Table Border Color for the New Tables:
- Access the Table Tools Design contextual tab (highlighted in red within Figure 1, shown earlier on this page) of the Ribbon by selecting any existing table, or by inserting and selecting a dummy table which you
can delete later.
- Within the Table Tools Design tab select a color for your table borders from the Pen Color drop-down gallery, as explained in Steps 1, 2, and 3 in the preceding section.
- Click the Draw Table button (highlighted in red within Figure 9). Your cursor should change to a Pencil icon as shown in Figure 9 (highlighted in blue). And also, you should be able to see your selected color within the Pen Color section, as shown highlighted in green within Figure 9. Draw a table as explained in our Draw Tables in PowerPoint 2013 for Windows tutorial (refer to Figure 9).
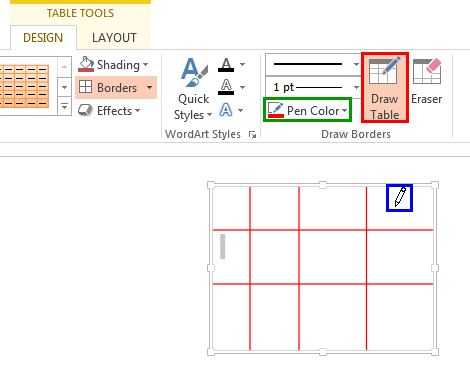
Figure 9: Border color selected for the new table to be drawn - Figure 10 shows our sample table after we finished drawing, and distributed rows and columns.

Figure 10: Table drawn with selected border color - Save your presentation often.


