Yes, you insert a chart on your slide, and then you spend an hour slaving over this chart to get it just perfect! You really do not want to spend a few more hours creating more charts just like the one you created. It's only fair to have to do this task once, and then easily replicate your chart formatting thereafter for any new charts you may want to create.
You can actually attain this objective by saving your chart's formatting attributes as a chart template. Saving a chart template saves all the tweaks and formatting you made. Thereafter, you can use the chart template as a starting point to create a new chart. And you can make multiple chart templates and save them to use later.
Follow these steps to learn how to save a chart as template in PowerPoint 2011 for Mac:
- Select the chart that you want to save as a template, as shown in Figure 1, below.
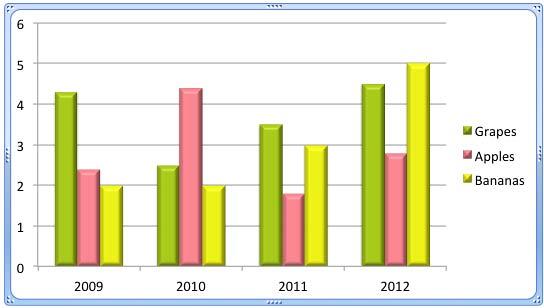
Figure 1: Formatted chart selected - With the chart still selected, access the Charts tab of the Ribbon that you can see highlighted in red within Figure 2, below, and then click the Other button, as shown highlighted in blue within Figure 2.

Figure 2: Other button within the Charts tab of the Ribbon - Doing so opens the Other charts gallery as you can see in Figure 3, below. In this gallery, select Save as Template, which is the last option.
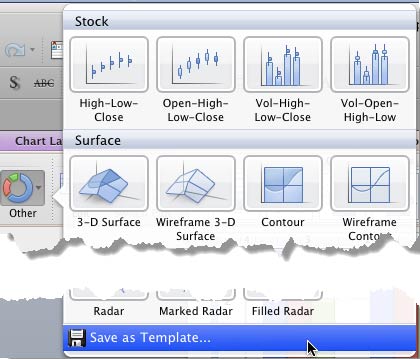
Figure 3: Other Charts gallery - Alternatively, you can just right-click (or Ctrl+click) the selected chart and from the resultant menu, select the Save as Template option, as shown in Figure 4, below.
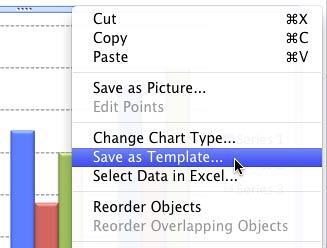
Figure 4: Save as Chart Template option is selected - Either way, you bring up the Save Chart Template dialog box, as shown in Figure 5, below. Note that you should not change the folder location if you want to use this template on the same computer where it was created. Give your template a name, as shown highlighted in red within Figure 5, and save it by clicking the Save button, as shown highlighted in blue within Figure 5.
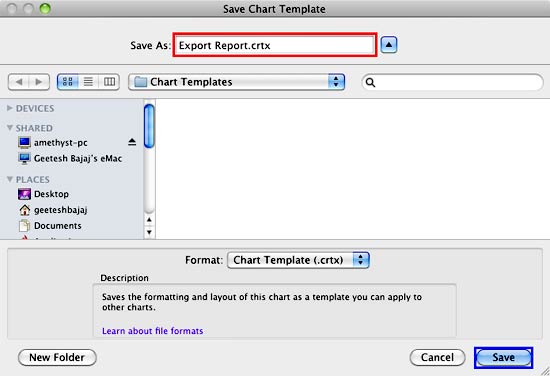
Figure 5: Save Chart Template dialog box Use File Names that Make Sense
- It is a good idea to give a nice, descriptive name that you can remember later the default name given by PowerPoint My Chart.crtx may mean nothing to you next week, but something like Primary Colors Column Chart.crtx may make so much more sense! Note that the extension crtx is automatically suffixed to the file name you choose crtx is the chart template format that PowerPoint and other Microsoft Office applications use.
- Hereafter, when you want to use this template as a starting point for a new chart, access the Charts tab of the Ribbon, and click the Other button. Doing so opens the Other charts gallery, as shown in Figure 6, below. Within the Other charts gallery you will see a new category named Templates, as shown highlighted in red within Figure 6. This category includes all of the chart templates you have saved. Click on the chart template of your choice. PowerPoint will create a new chart based on the selected template.
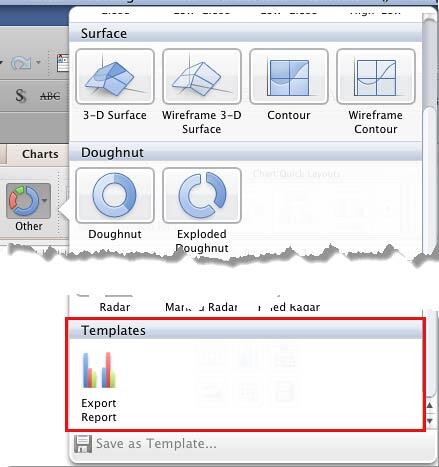
Figure 6: New Chart Template within the Other Charts gallery - Save your presentation often.


