Once you insert a chart on your slide, you can tweak it as much as you want so that the resulting chart follows your specifications. You have now created a standard that you may want to replicate often. PowerPoint makes it easy to save any chart you create as a template. Saving a chart as a template saves all the tweaks you made, and you can use the template as a starting point to create another chart.
Follow these steps to learn how to save a chart as template in PowerPoint 2010 for Windows:
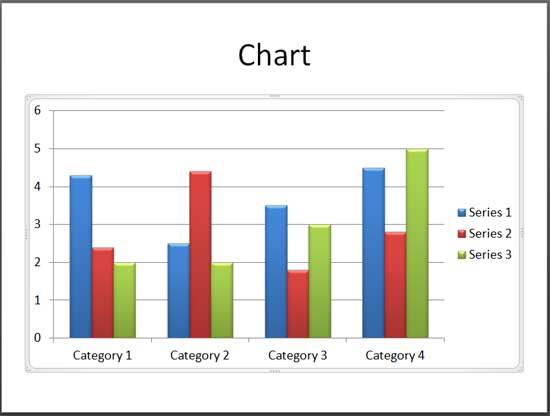
- Select the chart that you want to save as a template, as shown in Figure 1, below.

Figure 1: Chart selected in PowerPoint 2010 - Access the Chart Tools Design tab of the Ribbon. Locate the Type group within this tab, and click the Save As Template button, as shown highlighted in red within Figure 2, below.

Figure 2: Save As Template button within Type group of the Chart Tools Design tab Contextual Tabs
- All of the three Chart Tools tabs (Design, Layout and Format) are contextual tabs. Contextual tabs are the tabs in the Ribbon that are not visible all the time. They only make an appearance when you are working with a particular slide object which can be edited using special options.
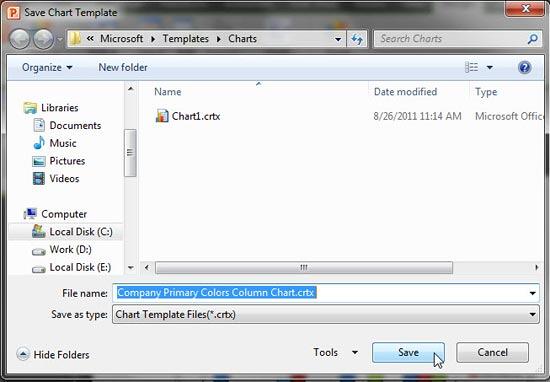
- Doing so brings up the Save Chart Template dialog box, as shown in Figure 3, below. Note that you don't have to choose a folder location if you want to use this template on the same computer where it was created. Give your template a name, and save it by clicking the Save button.

Figure 3: Save Chart Template dialog box Use File Names that Make Sense
- It is a good idea to give a nice, descriptive name that you can remember later - Chart1.crtx may mean nothing to you next week, but something like Company Primary Colors Column Chart.crtx may make so much more sense! Note that the extension CTRX is automatically suffixed to the file name you choose - CRTX is the chart template format that PowerPoint and other Microsoft Office applications use.
- The next time you want to use that template as a starting point for a new chart, click the Chart button on a content placeholder, or select the Insert tab of the Ribbon, and click the Chart button within this tab.
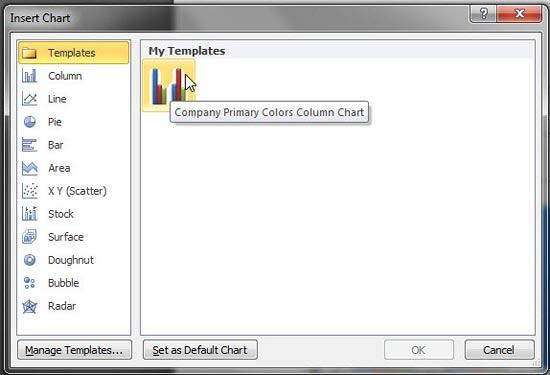
- Either way you will see the Insert Chart dialog box. The first category in the left pane is called Templates. Select this category to select any chart template you saved. Note that you can see a tool-tip when you hover your cursor over a custom chart template. This is essentially the name you provided to the CRTX file in Step 3. Select the chart template you want, and click the OK button.

Figure 4: Chart Template within Insert Chart dialog box - PowerPoint creates a new chart based on your template.
- Save your presentation often.


