Introduction
Using Raptivity Presenter - Interactive Graphs Pack
Pricing and Support
Conclusion
Introduction
Raptivity Presenter, a PowerPoint add-in that allows you to add interactivity to
your PowerPoint presentations, has already been reviewed on this site. In this review, I'll explore a new pack called the Interactive Graphs Pack for
Raptivity Presenter which allows you to add interactive graphs and charts.
Raptivity Presenter is from Harbinger, a company based out of USA and India -- Harbinger develops interactivity products such as
Raptivity and YawnBuster for procedural training,
management training, soft skills training, banking etc. You can learn more about Raptivity Presenter - Interactive Graphs Pack and download the trial version
from their site (link no longer exists).
The Interactive Graphs Pack includes 3D effects along with various graph and chart interactive features such as auto build-up, graph reading, legend picking,
cluster annotation etc. You can even import information from an Excel sheet to create a graph. The pack consists of two categories of graphs where one can either
focus on details of series or interpret the cluster as a whole instead of individual entries. You can export the graphs and charts into a PowerPoint file thereafter.
My contact at Harbinger for this review was Shivesh Vishwanathan -- thank you, Shivesh.
Back
Using Raptivity Presenter - Interactive Graphs Pack
Download the installer, run the setup routine and follow the instructions. When installed, follow these steps to use Raptivity Presenter - Interactive Graphs Pack:
- Open a presentation or create a new blank presentation in PowerPoint 2010,
change the slide layout to Blank by selecting
Home tab | Layout | Blank. And choose the Add-Ins tab on the Ribbon, as shown in
Figure 1.
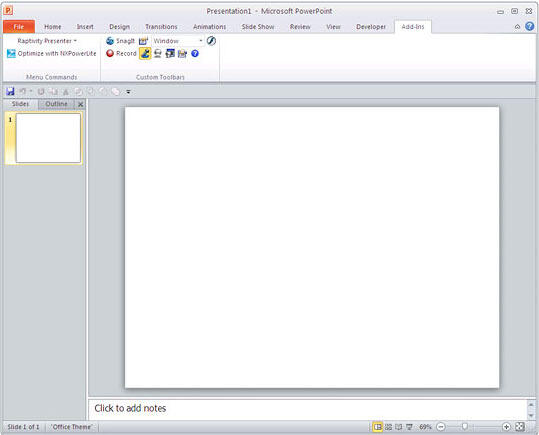
Figure 1: Add-Ins tab on the Ribbon- Within the Menu Commands group click the Raptivity Presenter button to get a drop-down list (see
Figure 2). Choose the New Interactivity option.
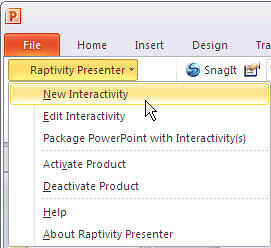
Figure 2: New Interactivity- This opens the Raptivity Presenter Media Explorer, as shown in Figure 3. Here you can select an interaction
model for customization. For this walkthrough, I chose the Interactive Graph Pack option (highlighted in red).
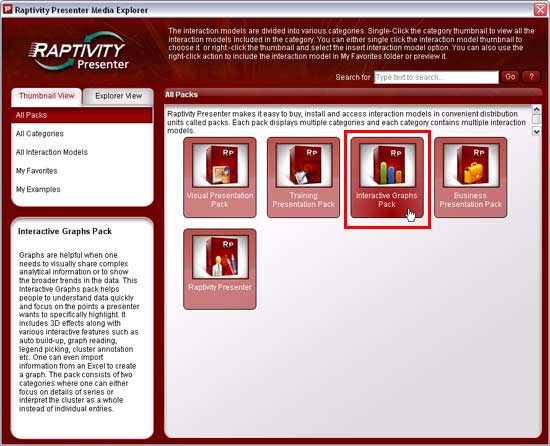
Figure 3: Raptivity Presenter Media Explorer- In the next window you can see the interactions available within the Interactive Graph Pack. These are either Graphs and Charts or
Cluster Annotation Graphs (see Figure 4). For this tutorial, I chose Graphs and Charts.
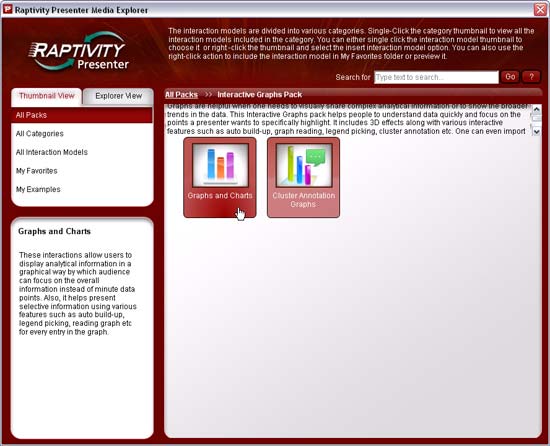
Figure 4: Graphs and Charts- This brings up the interactions within the Graphs and Charts category, as you can see in Figure 5. Choose any of the chart types.
I chose the Bubble Chart option.
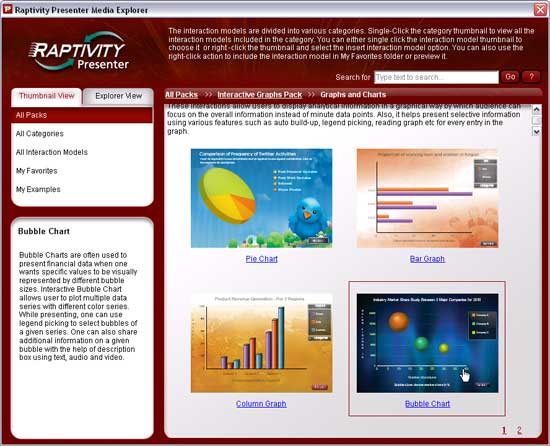
Figure 5: Interactions within Graphs and Charts- This opens the Raptivity Presenter interface, as shown in Figure 6. Here, the interactivity is added as 'Untitled1' in
the list on left. And at the same time based on the interactivity selected, a wizard launches (see Figure 6 again). Click Next to move to the
subsequent screens that allow you to include information about the project such as title, number of bubbles, etc.
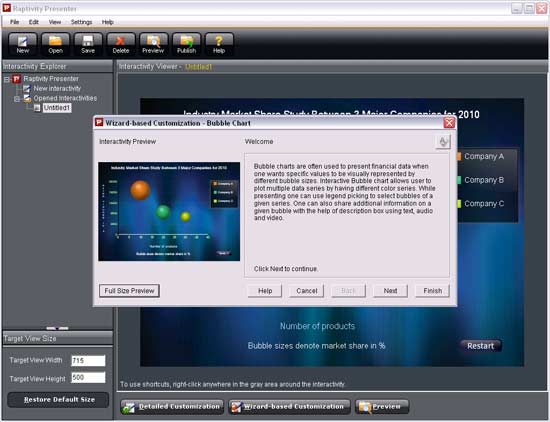
Figure 6: Raptivity Presenter interface- Once done, the Detailed Customization window opens (see Figure 7).
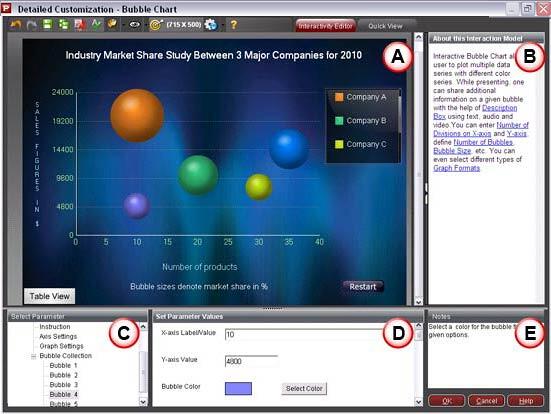
Figure 7: Detailed Customization window- This is where you can further tweak all the parameters for this interactivity.
- This area contains two tabs: The Interactivity Editor tab allows you to customize some of the parameters by clicking
on the interactivity. You can also create objects required for some of the interactivities. The Quick View tab allows you to preview the interactivity.
- About this Interaction Model section displays the functionality of the interaction model.
- Select Parameter provides customizable parameters based on what interactivity you have selected.
- Set Parameter Values displays the parameters for the object selected under the Select Parameter area.
- The Notes section shows helpful info for the parameter being customized.
- As soon as the parameter value is changed, the preview is updated to show the change.
- Other than object parameters, you can undo/redo any operation. Apply an in-built color theme to the interactivity, do a spell
check using Raptivity Presenter's Spell Checker, and set the Target View Size of the interactivity. Once done, click the
OK button.
- This will bring you back to the Raptivity Presenter interface, as shown in Figure 8.
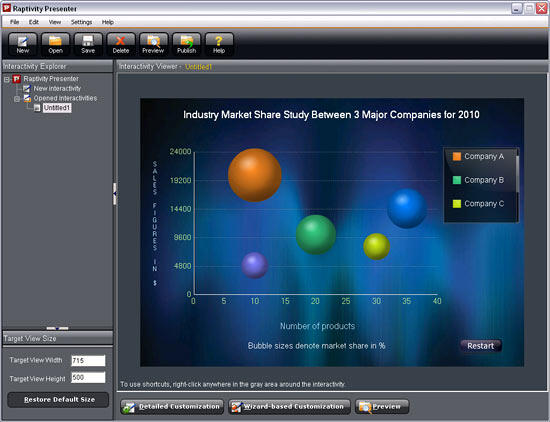
Figure 8: Raptivity Presenter interface- Save your interactivity by clicking the Save icon on the toolbar -- or choose File | Save Raptivity.
The file is saved with an .RPP extension.
- Once the interactivity is saved you can now publish it to your PowerPoint presentation. Figure 9 shows the interactivity placed
on the slide.
Figure 9: Interactivity on PowerPoint slide- You can view the interactivity in slideshow view within PowerPoint.
Back
Pricing and Support
Interactive Graphs Pack costs $299 if purchased individually. You can even buy Raptivity Presenter Gold which includes Interactive Graphs Pack. Multiple
license are available.
Support option includes e-mail, online training and phone support.
Back
Conclusion
Raptivity Presenter's Interactive Graphs Pack is a capable product that can be helpful in creating charts that look different than the default PowerPoint
offerings. Also, since charts created using the Interactive Graphs Pack are all Flash based, they include interactivity and animation out of the box. Having said
that, the Interactive Graphs Pack could benefit from fewer steps needed in creating a chart.
Back


