In a PowerPoint chart, the Plot Area is the layer placed between the Chart Area and other chart elements such as Data Series and Gridlines. This layer typically also has the axes on its perimeter. Look at Figure 1 below, where we have colored the Plot Area pink, so as to highlight it for you.
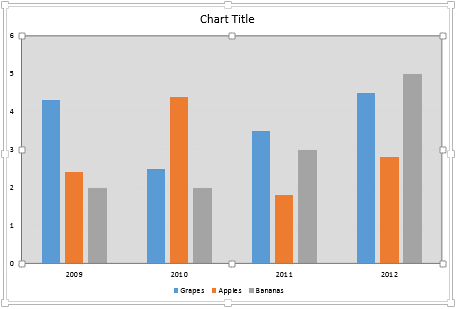
Figure 1: Plot Area
Typically the Plot Area looks as if it is merged into the Chart Area because both are filled entirely transparent, with no fill, and are placed one above the other. This can be seen more clearly in Figure 2 opposed to what you see in Figure 1. So, you may not be able to distinguish it from the Chart Area. This default status works well. However, you can format the Plot Area separately to highlight it. You can change its appearance by applying fills, borders, and effects with just a few clicks in PowerPoint 2013.
Follow these steps to explore more in PowerPoint 2013 for Windows:
- Select the chart that you want to format the Plot Area for. If you don't have an existing chart, insert a new chart in your slide.
- Now, carefully right-click the Plot Area to bring up a contextual menu as shown in Figure 2. In this contextual menu, select the Format Plot Area option (refer to Figure 2 again). If you do not get the Format Plot Area option in the contextual menu, you may have right-clicked on another chart element. Make sure you then deselect anything in the chart, and then right-click on the edge of the Plot Area.
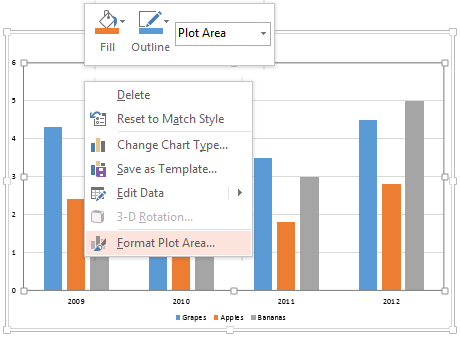
Figure 2: Format Plot Area option - Doing so opens the Format Plot Area Task Pane, as shown in Figure 3. In this Task Pane, you'll find two tabs that provide you with all formatting options for the Plot Area:
- Fill & Line
- Effects
- Select the Fill & Line tab, highlighted in red within Figure 3.
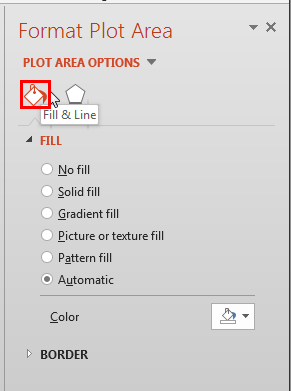
Figure 3: Fill & Line tab within the Format Plot Area task pane - Options within the Fill & Line tab are mainly divided into two sections, Fill and Border.
- Options within the Fill section are used to apply (and edit) a fill type to the Plot Area, whereas the options within the Border section are used to apply (and edit) a border to the Plot area.
- To know more about these options, refer to our Fill and Line options for the Chart Area in PowerPoint 2013 tutorial. Even though the linked tutorial explains these options for the Chart Area, they work similarly with the Plot Area as well.
- Select the Effects tab, highlighted in red within Figure 4.
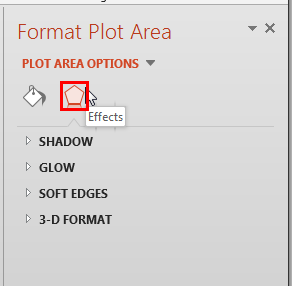
Figure 4: Effects tab within the Format Plot Area task pane - There are four options within the Effects tab, Shadow, Glow, Soft Edges, and 3-D Format. To learn about how to use these options, refer to our Effect Options for the Chart Area in PowerPoint 2013 tutorial. Once again, even though the linked tutorial explains these options for the Chart Area, they work in the same way for the Plot Area.
- Select the required options and format the Plot Area as required. In Figure 5, you can see that the Plot Area of our sample chart is filled with a gradient and also applied with a shadow (compare with partially visible chart in Figure 2).
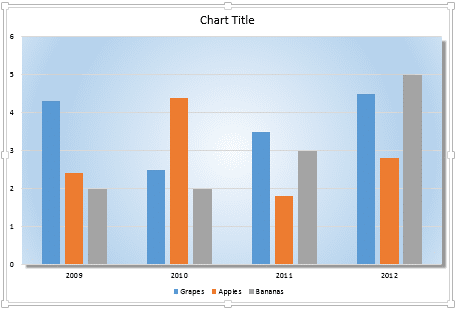
Figure 5: Plot Area with changed appearance - Save your presentation often.


