In a PowerPoint chart, the Plot Area is the layer placed behind the chart elements such as Data Series and Gridlines. This layer typically also has the axes on its perimeter. Look at Figure 1 below, where we have colored the Plot Area pink, so as to highlight it for you.
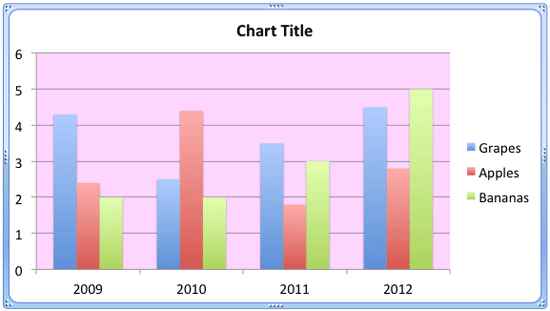
Figure 1: Plot Area
Typically the Plot Area looks as if it is merged into the Chart Area because both are filled entirely transparent, with no fill, and are placed one above the other. So, you may miss the difference between these chart elements. This default status works well. However, you can format the Plot Area separately to make it look prominent. You can change its appearance by altering fills and effects with just a few clicks.
Follow these steps to explore more in PowerPoint 2011 for Mac:
- Select the chart that you want to format the Plot Area for in PowerPoint 2011 for Mac. If you don't have a chart, insert a chart.
- Now, select either the Chart Layout or the Format tab of the Ribbon. Both tabs contain the Current Selection group that you can see in Figure 2, towards the extreme left. Within this group, you can see the Chart Elements selection box (highlighted in red within Figure 2). This selection box contains a list of chart elements in the selected chart. Within this list, click on the Plot Area option. Doing so will result in a tick mark prefixed to this option, as shown in Figure 2 to indicate its selected status.
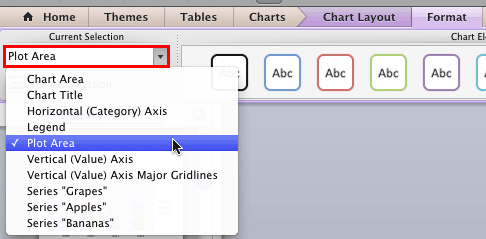
Figure 2: Plot Area selected Note: The
Chart Layout and
Format tabs are
contextual tabs. These tabs are special tabs in the
Ribbon that are not visible all the time. They only make an appearance when you are working with a particular slide object which can be edited using special options.
- Below this Current Selection list is the Format Selection button, as shown highlighted in red within Figure 3. Click this button.
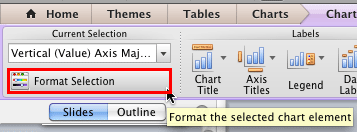
Figure 3: Format Selection button - Now, carefully right-click (or Ctrl+click) the Plot Area (make sure that the Chart Elements selection box is still showing the Plot Area option). From the contextual menu that appears, select the Format Plot Area option as shown in Figure 4.
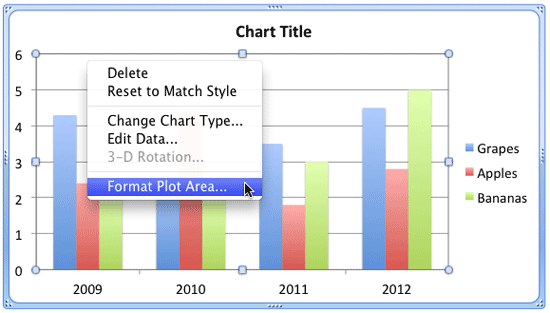
Figure 4: Format Plot Area option - Doing so summons the Format Plot Area dialog box, as shown in Figure 5.
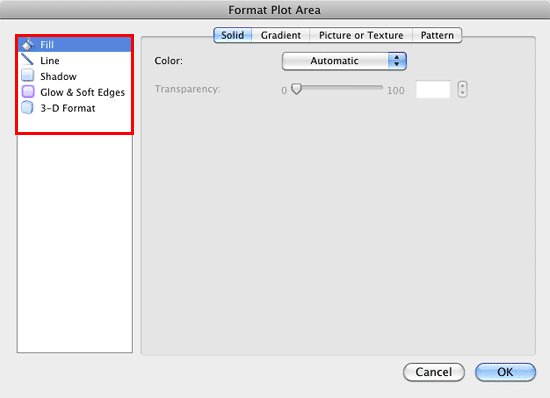
Figure 5: Format Plot Area dialog box - In this dialog box, you can see various options (within the sidebar as shown highlighted in red within Figure 5, above) that help you to format the Plot Area. Let us explore each of them. For more information on each of these options, refer to the tutorials linked. Even though the linked tutorials are related to Shapes, the same techniques work with Plot Area too:
Fill
- This option is used to fill the Plot Area with a fill type such as Solid, Gradient, Picture or Texture, or Pattern. Select one of the tabs depending upon the fill type required. To learn more about these options, refer to our Fills for Shapes in PowerPoint 2011 for Mac tutorial.
Line
- Selecting this option will bring up three tabs, Solid, Gradient, and Weight & Arrow. By default you can't see any boundary line around the Plot Area. However, by using options within these tabs you can add a nice outline to your Plot Area. Get more info on how to add and edit lines in our Formatting Lines (and Shape Outlines) in PowerPoint 2011 for Mac tutorial. Remember though that you can't use the Arrow options with Plot Area since it is a closed shape.
Shadow
- Includes options to add a shadow to the Plot Area. Learn more about these options in our Advanced Shadow Effect Options in PowerPoint 2011 for Mac tutorial.
Glow & Soft Edges
- Glow effect adds a nice halo around the selected Plot Area whereas Soft Edges effect adds an eaten-up, feathered edge to the selected Plot Area. Select any of these options as required.
Note: Remember that you cannot see the effect of selecting Glow & Soft Edges options on the Plot Area until you select any fill for it.
3-D Format
- You can't apply any 3-D format to the Plot Area since all options here are greyed out.
- Select the required option and format the Plot Area as required. In Figure 6, you can see that the Plot Area of our sample chart is filled with grey color and includes an outline (compare with partially visible chart in Figure 4).
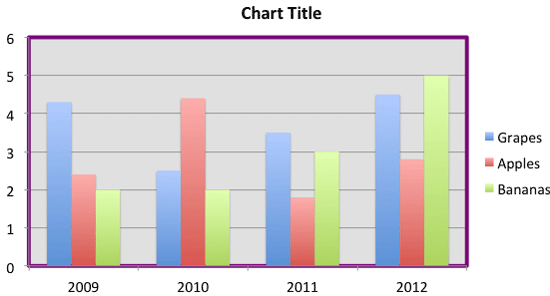
Figure 6: Plot Area with changed appearance - Save your presentation often.


