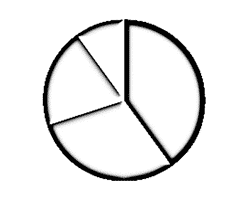
Learn about pie charts, and how you can use them within PowerPoint. Like for most charts, PowerPoint provides several variations for pie charts.
Author: Geetesh Bajaj
Product/Version: PowerPoint
OS: Microsoft Windows and Mac OS X

Pie charts show the relative sizes of items in one data series, proportional to the sum of the items. The data points in a pie chart are displayed as a percentage of the whole pie, where the sum of all values totals 100%.
Consider using a pie chart when:
Scroll down to the bottom of the page to see a sample presentation containing pie chart types and subtypes:
Pie charts have the following subtypes:
Pie charts display the contribution of each value to a total. You can pull out slices of a pie chart manually to emphasize the slices.
The Pie in 3-D variation works in the same as the pie chart but has a 3-D effect added.
The Pie of pie variation displays pie charts with user-defined values that are extracted from the main pie chart and combined into a secondary pie chart. These chart types are useful when you want to make small slices in the main pie chart easier to distinguish.
The Bar of pie variation displays pie charts with user-defined values that are extracted from the main pie chart and combined into a stacked bar chart.
Exploded pie charts display the contribution of each value to a total while emphasizing individual values. You can change the pie explosion setting for all slices and individual slices, but you cannot move the slices of an exploded pie manually. If you want to pull out the slices manually, consider using a Pie or Pie in 3-D chart variations instead.
Exploded pie charts can be displayed in 3-D format.
Click below to view on SlideShare
Click below to view on YouTube
PowerPoint Chart Types: Pie Charts in PowerPoint (Glossary Page)
You May Also Like: Pivot Tables in PowerPoint: by Kasper Langmann | Blackberries PowerPoint Templates


Microsoft and the Office logo are trademarks or registered trademarks of Microsoft Corporation in the United States and/or other countries.