When a new chart is inserted into your PowerPoint presentation, you will find that the chart’s fills and border types are based on the Theme of your presentation. You can change these fills and borders for charts as needed. Alternatively, you can always use pictures as fills. Imagine a chart that shows fruit exports, and each column of the chart is filled with pictures of a particular fruit type rather than the conventional solid color fills or geometric patterns. Also, if you wanted to show how the export of grapes has increased over the years, your column chart would have all columns filled with pictures of grapes stacked one over the other.
Follow these steps to apply picture fills to any chart series in PowerPoint 2011 for Mac:
- To add a picture fill to chart series, you must start with an existing chart in your presentation. For this tutorial, we use a column chart, as shown in Figure 1, below.
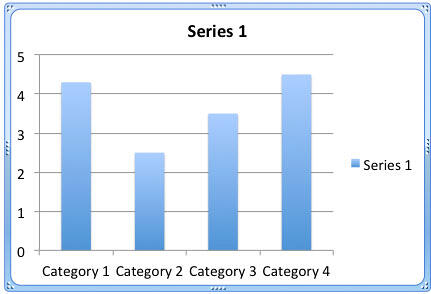
Figure 1: Column Chart selected in PowerPoint - Select the data series by clicking on it, as shown in Figure 2, below. Alternatively, you can select the data series from the Chart Elements drop-down list, as shown highlighted in red within Figure 3, later on this page.
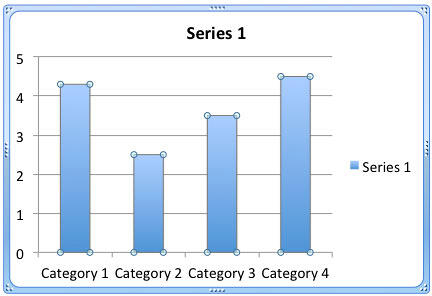
Figure 2: Selected data series - With the data series selected, select either the Chart Layout or the Format tab of the Ribbon, as shown in Figure 3, below. Within any of these tabs, you will find the Current Selection group towards the extreme left, as shown in Figure 3. Within this group, make sure that the Chart Elements drop-down list, as shown highlighted in red within Figure 3, is displaying the name of the selected data series. Then, click the Format Selection button below it, as shown highlighted in blue within Figure 3.
- [an error occurred while processing this directive]
Figure 3: Format Selection button to be clicked with the data series selected
- This action summons the Format Data Series dialog box, shown in Figure 4, below. Make sure that the Fill option in the sidebar is selected. Then, select the Picture or Texture tab, as shown highlighted in red within Figure 4.
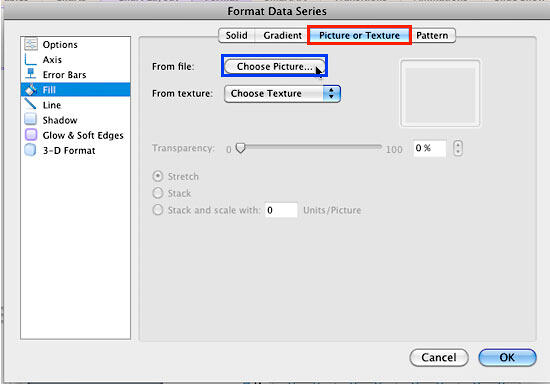
Figure 4: Picture or Texture tab selected within the Format Data Series dialog box - Within the Picture or Texture tab, click the Choose Picture button, as shown highlighted in blue within Figure 4, above.
- Doing so brings up the Choose a Picture dialog box, as shown in Figure 5, below. Navigate to, and select the picture you want to use as the fill for your data series, and then click the Insert button, as shown highlighted in red within Figure 5.
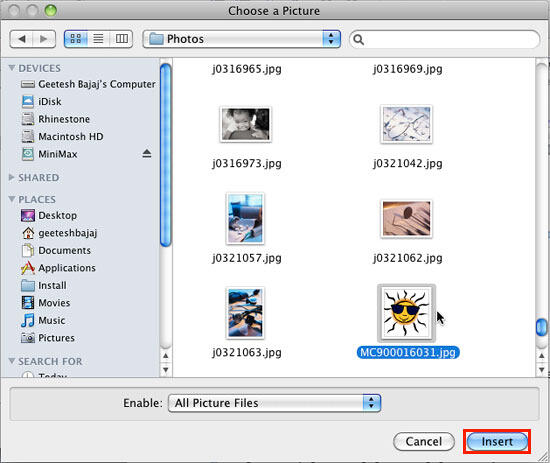
Figure 5: Choose a Picture dialog box - This action will take you back to the Format Data Series dialog box, where you can now see the selected picture in the preview area, as shown in Figure 6, below.
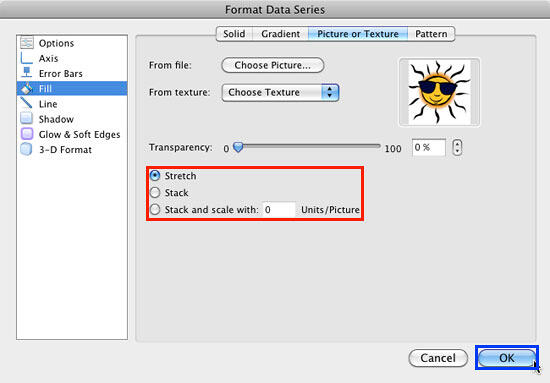
Figure 6: Stretch and Stack options within the Format Data Series dialog box - As you can see in Figure 6, above, there are several options available for stretching and stacking the filled picture, as shown highlighted in red within Figure 6, as explained below:
1. Stretch
- This option (selected by default) stretches the picture to fit within the series, as shown in Figure 7, below.
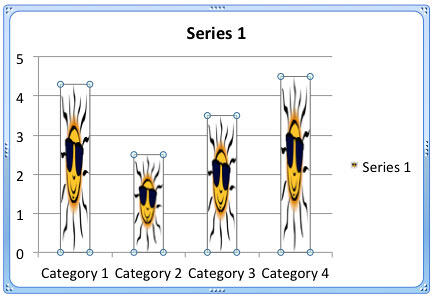
Figure 7: Picture inserted with Stretch option selected 2. Stack
- Creates copies of the picture in such a way that they can be placed on top of each other, Figure 8, below, provides a better idea.
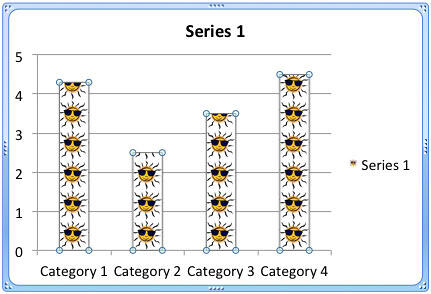
Figure 8: Picture inserted with Stack option selected 3. Stack and Scale with 'n' units/picture
- Here you can enter the number of units (denoted by 'n') per picture. See Figure 9, below, where we have used 2 as the number to stack and scale.
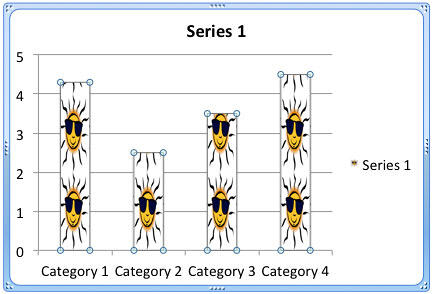
Figure 9: Picture inserted with Stack and scale option selected
- You can also apply transparency to the Picture (or Texture) fill using the Transparency slider within the Format Data Series dialog box.
- When done, click the OK button, as shown highlighted in blue within Figure 6, above, to get back to the chart.
- Save your presentation often.
Use Suitable Pictures
Try and use simple pictures as far as possible with few colors and less detail -- if you choose very detailed pictures with too much color or even too many elements, you might lose the impact of this technique altogether.


