Indezine Logo


Inserting Charts in PowerPoint 2010 for Windows

Learn how you can insert a chart in PowerPoint 2010 for Windows. While inserting, you can choose the chart type you want to insert.


Author:

Product/Version: PowerPoint 2010 for Windows

OS: Microsoft Windows XP and higher


Learn PowerPoint

Paste Special In PowerPoint


Before You Begin: If the data on which you want to base your chart is already available within Excel 2010, create your chart in Excel, and then copy-paste it into a PowerPoint slide.

Follow these steps to insert a new chart in PowerPoint 2010 for Windows:
  1. Create a new presentation in PowerPoint, or open an existing presentation.
  2. When you insert a new slide in PowerPoint, it uses the default Title Slide layout.
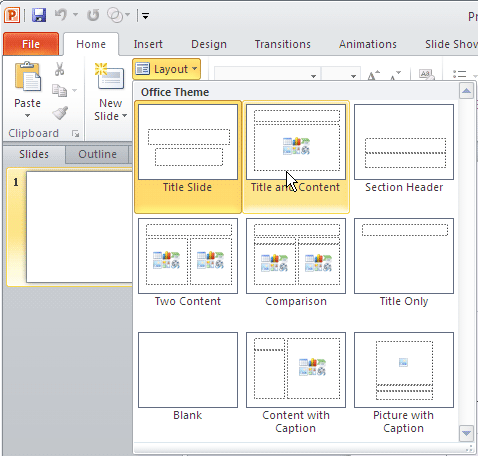
  3. Click the Layout button/option in the Home tab of the Ribbon to bring up the Layout gallery as shown in Figure 1.
  4. Select any of the layouts that include a content placeholder (the small palette like collection of multicolored buttons visible on some of the slide layouts).
  5. Layout gallery
    Figure 1: Layout gallery
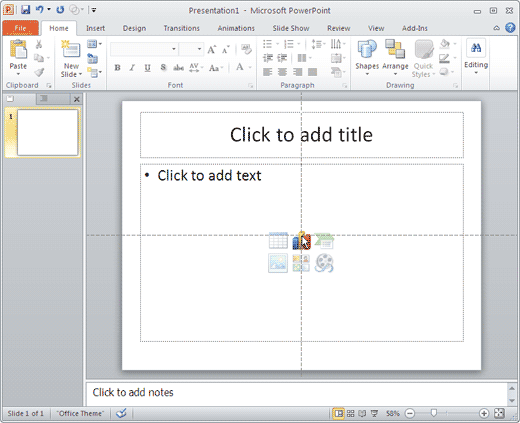
  6. If your slide layout has a content placeholder (see Figure 2), click the Chart button among the six buttons.
  7. Content Placeholder
    Figure 2: Content Placeholder
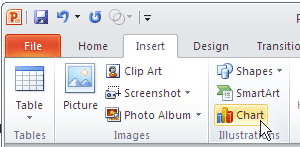
  8. Alternatively, if you want to insert a chart in an existing slide that has no content placeholder, just select the Insert tab of the Ribbon, and click the Chart button, as shown in Figure 3.
  9. Chart button within the Insert tab
    Figure 3: Chart button within the Insert tab
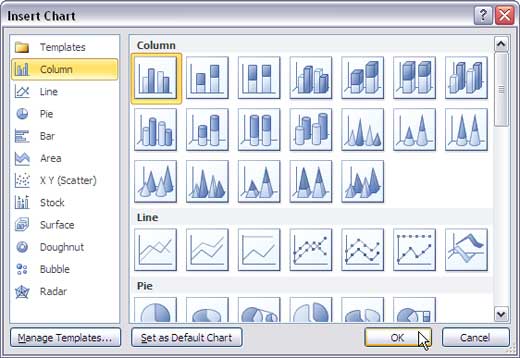
  10. Either of these options opens the Insert Chart dialog box that you can see in Figure 4.
  11. Insert Chart dialog box
    Figure 4: Insert Chart dialog box
  12. The left column lists the types of charts that you can create in PowerPoint, and the area towards the right shows several chart possibilities using a selected chart type.
  13. Select a particular chart variant. If you can't find the chart variant you want, just choose something similar to the one you want (editing it later is easy). Click OK.
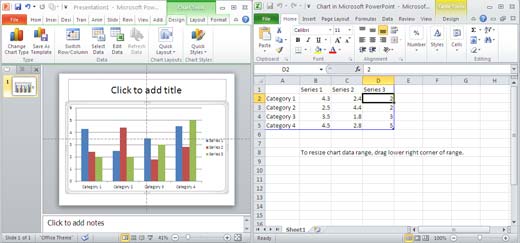
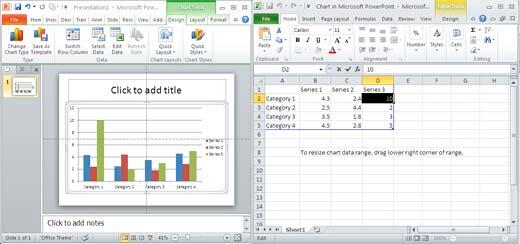
  14. Doing so will place a chart on the slide that is based on dummy data. At the same time, this launches Microsoft Excel in a separate window as shown in Figure 5, containing the dummy data of the chart.
  15. Chart and Excel with default values
    Figure 5: Chart and Excel with default values
  16. Note: If you don't have Excel 2010 installed on the same system as PowerPoint 2010, then you'll see Microsoft Graph instead of Microsoft Excel. This works exactly the same way as in versions 2002 and 2003 of PowerPoint. You can learn more here.
  17. You now need to replace the dummy data in the Excel sheet with your own data. Follow these guidelines:
    1. Select a cell in the Excel sheet, and enter the new value.
    2. You can move to the cell towards the right in the Excel sheet by pressing the Tab key. Or, move to the cell below by pressing the Enter(Return) key.
    3. To insert a new column in the Excel sheet, right-click the header of the next column and choose the Insert option.
    4. To insert a new row in the Excel sheet, right-click the header of the next row and choose the Insert option. Remember, column or row content inserted this way ends up as a new series value in your chart.
    5. You can also delete columns and rows. Just select the row or column header, right-click, and choose the Delete option.
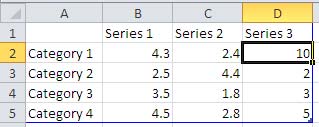
  18. Refer to Figure 5 above which has default chart values. The changed values can be seen in Figure 6.
  19. If you can't see the values in Figure 5 because they are so small in size, just trust us when we say the values were different from what you see in Figure 6!
  20. Changed values
    Figure 6: Changed values
  21. Any changes you make in the Excel sheet (refer to Figure 6 above) will reflect as changes on the chart within PowerPoint, as shown in Figure 7.
  22. Updated chart in PowerPoint
    Figure 7: Updated chart in PowerPoint
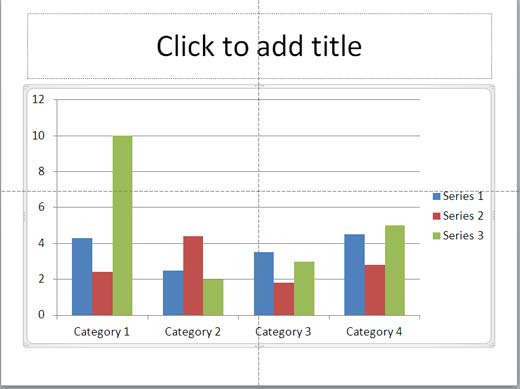
  23. Close Microsoft Excel to apply those changes on the chart (see Figure 8).
  24. Inserted Chart
    Figure 8: Inserted Chart
  25. To make more changes, select the chart so that the Ribbon area shows the Chart Tools Design tab as shown in Figure 9. Now click the Edit Data button. This opens the Excel sheet again, where further changes in the values can be made.
  26. Edit data
    Figure 9: Edit data
  27. Tip: You can also right-click the chart, and choose the Edit Data option to achieve the same result.


See Also:

Chart Basics: Inserting Charts (Glossary Page)

Inserting Charts in PowerPoint 2016 for Windows
Inserting Charts in PowerPoint 2013 for Windows
Inserting Charts in PowerPoint 2011 for Mac
Inserting Charts in PowerPoint 2007 for Windows
Inserting Charts in PowerPoint 2003 for Windows

You May Also Like: Visme: Conversation with Payman Taei | Benelux PowerPoint Templates


Popular Posts

Playing Video Across Slides in PowerPoint 2016 for Windows
Play a video clip across slides in PowerPoint 2016 for Windows.

Set Document Resolution in PowerPoint 2016 for Windows
Learn how to set document resolution in PowerPoint 2016 for Windows.

Creating Anchor Points for Connectors in PowerPoint 2010 for Windows
Learn how to create Anchor Points for connectors in PowerPoint 2010.

Working With Slide Numbers in PowerPoint 2016 for Windows
Learn how to add Slide Numbers on slides and Masters and more tricks on making them work to your will in PowerPoint 2016 for Windows.


Gears for PowerPoint (Series 01)

All these gears are native PowerPoint shapes. You can recolor them, add effects, and do more, all inside PowerPoint. Results which would have taken hours to achieve now take less than a minute! Have fun using the gear graphics, and make your audience take notice! All these gears can be rotated and resized, as required. Since they are essentially pictures, all types of edits that you can do with pictures work with them too!

Get this complete kit now, you’ll save so much time that you can use doing something else!


Microsoft and the Office logo are trademarks or registered trademarks of Microsoft Corporation in the United States and/or other countries.

Home | PowerPoint | Photoshop | PowerPoint Templates | PowerPoint Tutorials | Blog | Notes | Ezine | Media Kit | Feedback | Site Map | About Us | Contact Us

Link to Us | Privacy | Testimonials

PowerPoint Backgrounds | Christian PowerPoint Backgrounds | Business PowerPoint Presentation Templates

Plagiarism will be detected by Copyscape

©2000-2023, . All rights reserved.