Indezine Logo


Insert Tables in PowerPoint 2011 for Mac

Learn how to insert a table in PowerPoint 2011 for Mac. There's more than one way to insert a table.


Author:

Product/Version: PowerPoint 2011 for Mac

OS: Mac OS X


Learn PowerPoint

Do you know how to use animation for individual bullets by using multiple text boxes in PowerPoint?


We all use tables in our slides all the time to present numeric data in an organized way so that the audience can easily comprehend or compare values and understand trends. It's quite easy to insert a new table, yet there's more than one way to do this simple task.

In fact, there are three distinct ways to insert a table on your slide in PowerPoint 2011 for Mac:

  1. Select the Insert | Table menu option
  2. Use the New option within the Tables tab of the Ribbon
  3. In a Content placeholder, click the Insert Table icon

The first two ways are helpful when you want to add a table on a slide that has no Content placeholder, while the third option works best when you want to add a table within an existing slide that includes a Content placeholder (we explain more later in this tutorial). Based on your requirement, select any of the three methods. We explain these methods in more detail below:

Insert Table Using the Insert Menu

Follow these steps to insert a table using the Insert menu in PowerPoint:
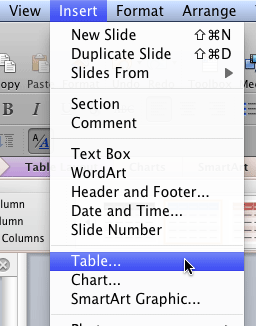
  1. Select the Insert menu and choose the Table option, as shown in Figure 1, below.
  2. Insert | Table menu option
    Figure 1: Insert | Table menu option
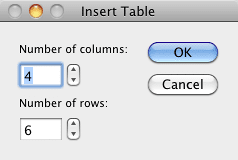
  3. Doing so brings up the Insert Table dialog box, as shown in Figure 2, below. In this dialog box, enter the required number of columns and rows for your table and click the OK button.
  4. Insert Table dialog box
    Figure 2: Insert Table dialog box

Insert Table Using the Tables tab of the Ribbon

Follow these steps to insert a table from the PowerPoint Ribbon:
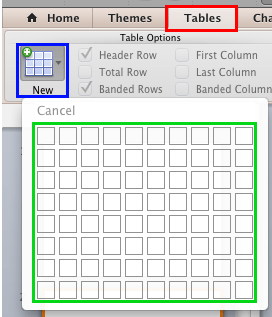
  1. Access the Tables tab of the Ribbon, as shown highlighted in red within Figure 3, below. Within this tab, click on the New button, as shown highlighted in blue within Figure 3, to bring up a set of cells arranged in rows and columns, as shown highlighted in green within Figure 3.
  2. New button within the Tables tab
    Figure 3: New button within the Tables tab
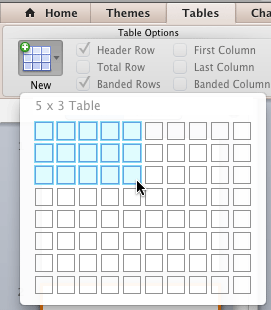
  3. Hover your cursor over the set of cells starting from the top-left corner to choose how many rows and columns you need for your table. We selected 5 columns and 3 rows, as can be seen highlighted in Figure 4, below. This means our new table will have 5 columns and 3 rows.
  4. Highlighted cells indicate the number of columns and rows being added
    Figure 4: Highlighted cells indicate the number of columns and rows being added
  5. Once the required number of rows and columns are selected, click your mouse to place a table on the active slide.

Insert Table in a Content placeholder

Follow these steps to insert a table using a Content placeholder:
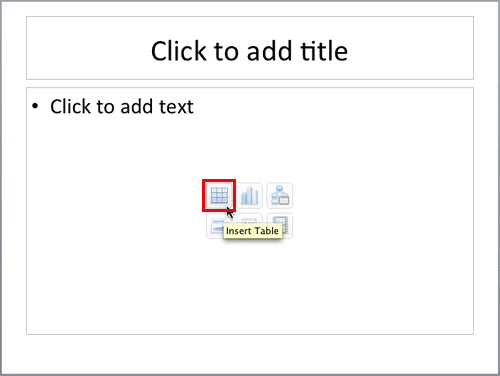
  1. A Content placeholder is a palette of six icons, as shown in Figure 5, below. If your slide has a Content placeholder, click the Insert Table icon, as shown highlighted in red within Figure 5.
  2. Insert Table icon within the content placeholder
    Figure 5: Insert Table icon within the content placeholder
  3. Doing so brings up the same Insert Table dialog box, as shown in Figure 2, previously on this page. In this dialog box, enter the required number of columns and rows for your table and click the OK button.

The result of following any of the three methods explained above is a table inserted on your active slide, as shown in Figure 6, below. The number of rows and columns may be different depending upon the choices you made.
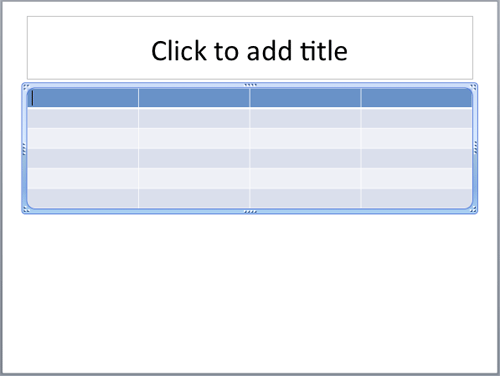
Table inserted on the slide
Figure 6: Table inserted on the slide

Once you add a table, you can:

Make sure to save your presentation often.


See Also:

12-01-01 - Table Basics: Insert Tables (Glossary Page)

Insert Tables in PowerPoint 2013 for Windows

You May Also Like: Use Excel Content as Tables in PowerPoint 2011 for Mac | To Empower Others: Use the Four Cornerstones of Effective Feedback


Popular Posts

Pivot Tables in PowerPoint: by Kasper Langmann
One of the most commonly used features in Microsoft Excel is the Pivot Table. A Pivot Table simply allows you to make better sense of data by giving you different options of how to view that data.

Get More SmartArt Graphics
Learn how you can get more SmartArt graphic variants.

Character Spacing in PowerPoint 2013
Explore Character Spacing options in PowerPoint 2013.

Add Secondary Value Axis to Charts in PowerPoint 2013 for Windows
Learn how to add a Secondary Value axis to charts in PowerPoint 2013 for Windows.


Organic Shapes with Brush Edges

You get 8 shape types plus lines as part of this Organic Shapes collection. Each of these 8 shape types have 10 variants. So you end up with 80 hand-drawn shape options! Again each of these 80 shapes have 12 brush stroke styles! Plus you get the lines and arrows in 12 brush stroke styles too. Combine all variations to end up with more than 3000 possibilities.

Buy and Download for $99+ (83 MB)


Microsoft and the Office logo are trademarks or registered trademarks of Microsoft Corporation in the United States and/or other countries.

Home | PowerPoint | Photoshop | PowerPoint Templates | PowerPoint Tutorials | Blog | Notes | Ezine | Media Kit | Feedback | Site Map | About Us | Contact Us

Link to Us | Privacy | Testimonials

PowerPoint Backgrounds | Christian PowerPoint Backgrounds | Business PowerPoint Presentation Templates

Plagiarism will be detected by Copyscape

©2000-2023, . All rights reserved.