Learn how to insert a table in PowerPoint 2013 for Windows. There's more than one way to insert a table.
Author: Geetesh Bajaj
Product/Version: PowerPoint 2013 for Windows
OS: Microsoft Windows 7 and higher
We use tables in our slides to present numeric data in an organized way so that the audience can easily comprehend, compare values, and understand trends. It's quite easy to insert a new table, and there's more than one way to do this simple task.
There are two ways to insert a table on your slide in PowerPoint 2013 for Windows:
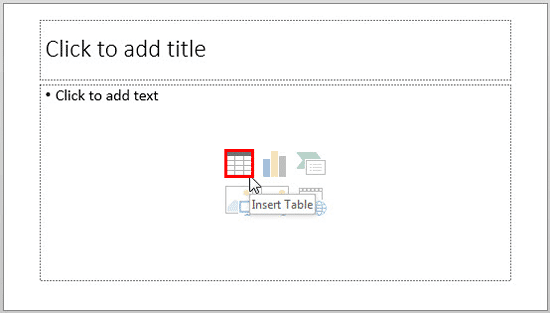
The first way is helpful when you want to add a table on a slide that has no Content placeholder, while the third option works best when you want to add a table within an existing slide that includes a Content placeholder. Based on your requirement, select any of the two methods as explained on this page.
A Content placeholder, as shown in Figure 7, later on this page, is a boxed area that lets you add either bulleted text or six other content types in your slide—most Slide Layouts contain Content placeholders.
Follow these steps to add a table to any PowerPoint slide:
Navigate to the slide where you want to add a table. Then, select the Insert tab of the Ribbon, as shown highlighted in red within Figure 1, below. Within this tab, click the Table button, as shown highlighted in blue within Figure 1, to bring up the Table drop-down gallery.
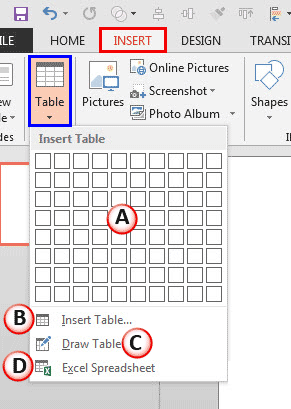
Figure 1: Table drop-down gallery
Let's explore all options within the Table drop-down gallery, as marked within Figure 1, above:
The topmost section within the Table drop-down gallery is a set of cells arranged in rows and columns, as shown highlighted in red within Figure 2, below. Hover your cursor over the set of cells starting from the top-left corner to choose how many rows and columns you need for your table. Figure 2 shows cells in 3 columns and 4 rows highlighted. When you hover your cursor over these cells, you can also see a Live Preview of the table being inserted on the active slide, as shown in Figure 2.
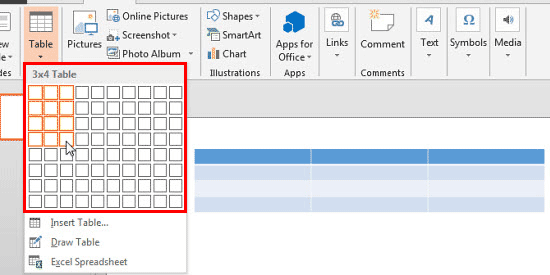
Figure 2: Cells highlighted to indicate the number of columns and rows in the table to be added
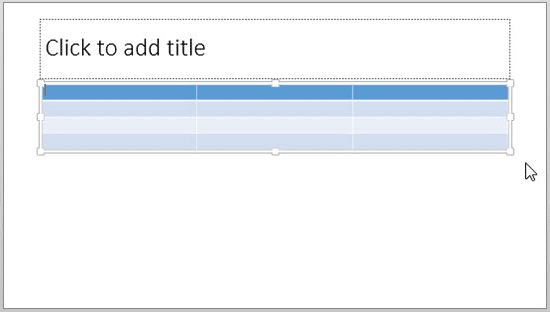
Once the required number of rows and columns are highlighted, just click to place an empty table containing the specified number of rows and columns on the active slide, as shown in Figure 3, below.
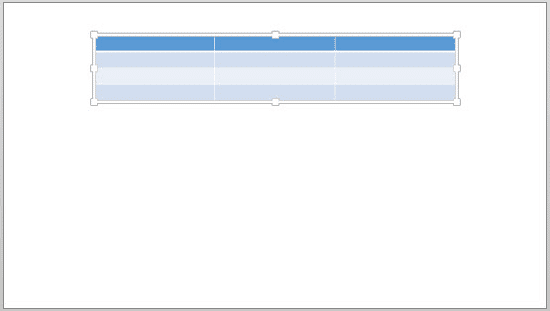
Figure 3: Table inserted on the blank slide
Selecting this option brings up the Insert Table dialog box as shown in Figure 4, below. In this dialog box, enter the required number of columns and rows within the boxes provided and click the OK button.

Figure 4: Insert Table dialog box
This action will place an empty table containing the specified number of rows and columns on the active slide, as shown in Figure 3, previously on this page.
When you select this option, the cursor changes to a pencil icon, as shown highlighted in red within Figure 5, below. Place your cursor on the Slide Area where you want to draw the table. Then, click and drag to draw the table's outer borders in the same way as you drag and draw to insert a shape. While drawing, you will see dashed lines to indicate the extent of the table's area.
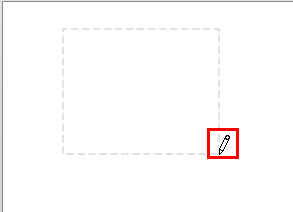
Figure 5: Table being drawn on the slide
Once the outer borders of your table are drawn, you can continue with drawing table cells as explained in our Draw Tables in PowerPoint 2013 for Windows tutorial.
This option inserts a typical Excel sheet with two rows and two columns on your PowerPoint slide, as shown in Figure 6, below. You can use the selection handles on the border of this sheet, as shown highlighted in red within Figure 6, to increase the number of rows and columns, as required.
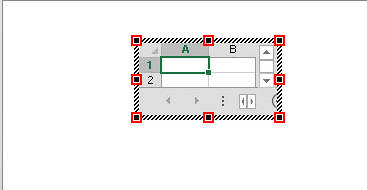
Figure 6: Excel Spreadsheet on the slide
Once the required number of rows and columns are in place, just click your mouse away from this Excel sheet to place a table on the active slide. However, PowerPoint doesn't consider this as a native table. Rather this is essentially an Excel object. Learn more in our Insert Excel Objects in PowerPoint 2013 tutorial.
Select any of the above options as required to insert a table on the slide.
Once you add a table, you can:
Make sure to save your presentation often.
See Also:
12-01-01 - Table Basics: Insert Tables (Glossary Page)
Insert Tables in PowerPoint 2011 for Mac
You May Also Like: Animate Ungrouped Tables in PowerPoint 2013 for Windows | You Can Bank on Your Voice, 2nd Edition: Conversation with Rodney Saulsberry


Microsoft and the Office logo are trademarks or registered trademarks of Microsoft Corporation in the United States and/or other countries.