Indezine Logo


Effect Options for the Chart Area in PowerPoint 2013 for Windows

Learn how to add effects to the Chart Area in PowerPoint 2013 for Windows. These effects must be used sparingly, as far as possible.


Author:

Product/Version: PowerPoint 2013 for Windows

OS: Microsoft Windows 7 and higher


Learn PowerPoint

Learn about using transparent pattern fills in PowerPoint.


There are plenty of ways to make the Chart Area stand out on your slide. One method is to use the Fill and Line options to apply a fill and/or a border to the Chart Area. Additionally you can also apply any of the Effects that PowerPoint 2013 for Windows provides.

Now, follow these steps to learn about the various Effects that can be applied to the Chart Area:
  1. Select the chart that contains the Chart Area you want to format. If you don't have a chart on the slide, insert a new chart.
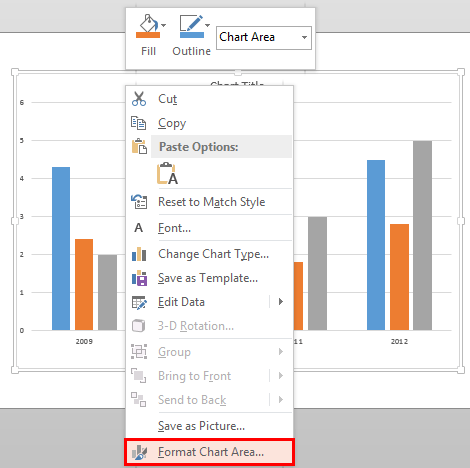
  2. Now, carefully right-click the Chart Area. From the resultant context menu, select the Format Chart Area option, highlighted in red within Figure 1, below.
  3. Format Chart Area option
    Figure 1: Format Chart Area option
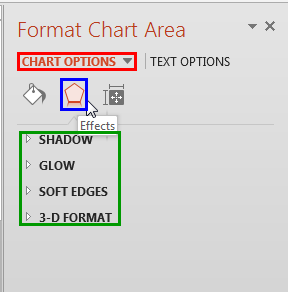
  4. Doing so opens the Format Chart Area Task Pane as shown in Figure 2, below. In this Task Pane, make sure that the Chart Options tab is selected (highlighted in red within Figure 2, below). Then click the Effects button (highlighted in blue within Figure 2, below).
  5. Format Chart Area Task Pane
    Figure 2: Format Chart Area Task Pane
  6. Here, you will find various Effects for the Chart Area, highlighted in green within Figure 2, below. Let us explore all of them. Do note that some of these options listed below link to further detailed tutorials. Although the linked tutorials pertain to shapes, the same principles hold good for effects within the Chart Area:
  7. Shadow

  8. Includes options to add (and edit) a shadow to the Chart Area as shown in Figure 3, below. Learn more about this option in our Advanced Shadow Effect Options in PowerPoint 2013 for Windows tutorial.
  9. Shadow Effect options
    Figure 3: Shadow Effect options
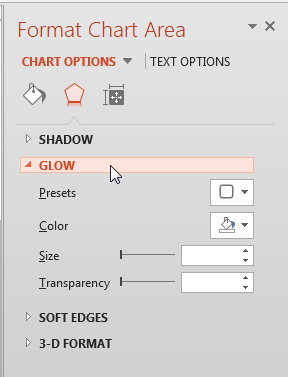
  10. Glow

  11. This effect (see Figure 4) adds a nice halo around the selected Chart Area. Refer to our Advanced Glow Options in PowerPoint 2013 for Windows tutorial to learn more.
  12. Glow Effect options
    Figure 4: Glow Effect options
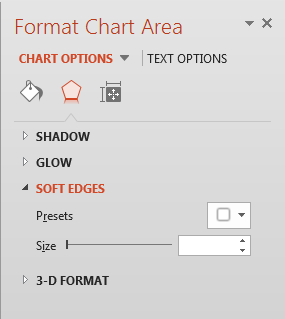
  13. Soft Edges

  14. This effect adds an eaten-up, feathered edge to the selected Chart Area. To learn more about the Soft Edges effect options that you see in Figure 5, below. Refer to our Advanced Soft Edges Options in PowerPoint 2013 for Windows tutorial.
  15. Soft Edges Effect options
    Figure 5: Soft Edges Effect options
  16. Note: Remember that you can not see the effect of selecting Soft Edges option on the Chart Area until you apply any fill to it.
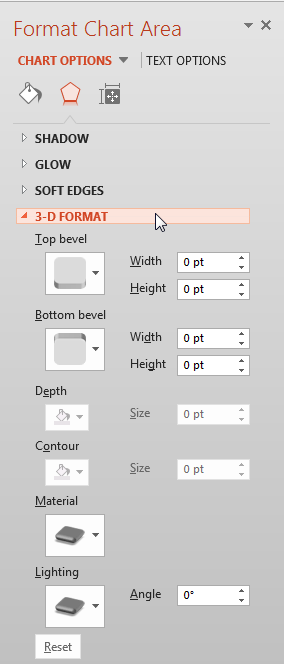
  17. 3-D Format

  18. Among the 3-D Format options that you see in Figure 6, all are available for the Chart Area except Depth and Contour options. To learn more about 3-D Format options, refer to our 3-D Format Options for Shapes in PowerPoint 2013 for Windows tutorial.
  19. 3-D Format Effect options
    Figure 6: 3-D Format Effect options
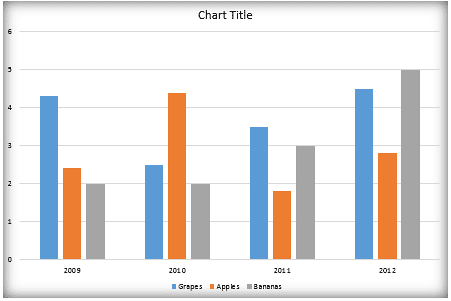
  20. Select the required Effect option and format the Chart Area as required. In Figure 7, below. You can see that the Chart Area of our sample chart is applied with a Shadow effect (compare with partially visible chart in Figure 1, shown previously on this page).
  21. Chart Area with a shadow applied
    Figure 7: Chart Area with a shadow applied
  22. Save your presentation often.

Chart Area: Effect Options for the Chart Area (Glossary Page)

You May Also Like: 3D Content Guidelines for Microsoft: Conversation with Michelle Maislen and Jeremy Kersey | Tartan PowerPoint Templates


Popular Posts

Keyboard Shortcuts for PowerPoint 2011 for Mac
Explore keyboard shortcuts in PowerPoint 2011 for Mac.

Insert Video from Facebook in PowerPoint 2016 for Windows
Learn how to insert video from your Facebook account in PowerPoint 2016 for Windows.

Add Pattern Fills to Shapes in PowerPoint 2010 for Windows
Add pattern fills to shapes in PowerPoint 2010 for Windows.

Gradient Fills for Text in PowerPoint 2013
Learn how to add gradient fills to selected text in PowerPoint 2013.


Polygon Center Circles for PowerPoint

These special circles have polygon centers: the centers are made of triangles, squares, pentagons, and hexagons! And based on the sides of the polygon, the rest of the circle has that many segments.

Download and use these Polygon Center Circles in your slides for just $4.99


Microsoft and the Office logo are trademarks or registered trademarks of Microsoft Corporation in the United States and/or other countries.

Home | PowerPoint | Photoshop | PowerPoint Templates | PowerPoint Tutorials | Blog | Notes | Ezine | Media Kit | Feedback | Site Map | About Us | Contact Us

Link to Us | Privacy | Testimonials

PowerPoint Backgrounds | Christian PowerPoint Backgrounds | Business PowerPoint Presentation Templates

Plagiarism will be detected by Copyscape

©2000-2023, . All rights reserved.