When you insert a new chart in PowerPoint, you might notice that an instance of the Excel sheet containing some dummy data for your chart pops up within PowerPoint. You then change the data within that instance of the Excel sheet to auto-update the chart on your slide. However, this Excel instance that stores your data has no separate existence. There's no separate Excel sheet that contains your data. In fact, this Excel sheet is stored within your PowerPoint presentation itself.
Do I Need Excel to add a Chart in PowerPoint?
To create and edit charts in PowerPoint 2016 for Windows, you must also have Excel 2016 installed.
Well, what do you do if you want to edit the chart data after a week, a month, or even a year after you created that chart? Simple, you just summon the instance of the Excel sheet containing the chart data again and make the required changes.
Follow these steps to learn more in PowerPoint 2016 for Windows:
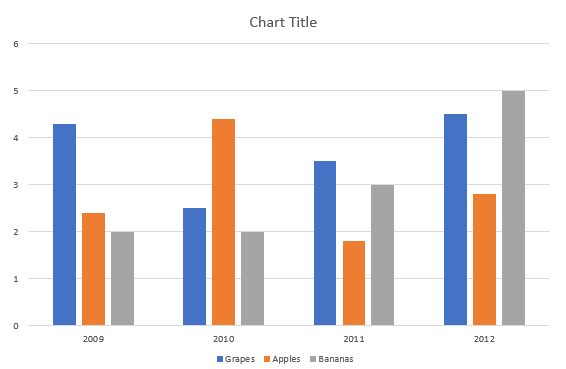
- Select the chart on your slide. For this tutorial we have used (and selected) a Column chart as shown in Figure 1, below.

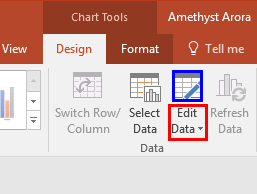
Figure 1: Chart selected on the slide - With the chart still selected, select the Chart Tools Design contextual tab of the Ribbon as shown in Figure 2, and click the lower half of the Edit Data button, highlighted in red within Figure 2, below.

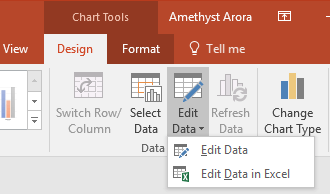
Figure 2: Edit Data button - Doing so opens the Edit Data drop-down menu containing two options, as shown in Figure 3, below.

Figure 3: Edit Data drop-down menu Edit Data
- Selecting this option will open an instance of the Excel sheet containing the chart data within PowerPoint as shown in Figure 4, below.

Figure 4: Instance of the Excel sheet containing the chart data opened within PowerPoint - You can also achieve the same result by either clicking the upper half of the Edit Data button, highlighted in blue within Figure 2, shown earlier on this page, or by right-clicking the chart and then selecting the Edit Data option within the resultant contextual menu.
Edit Data in Excel 2016
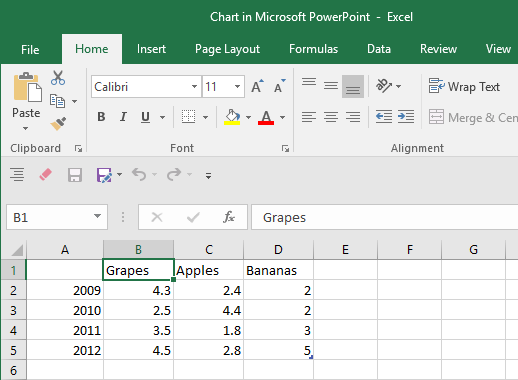
- Selecting this option will launch Excel 2016 with a new sheet containing the chart data, as shown in Figure 5, below.

Figure 5: Excel sheet containing chart data - Select either the Edit Data or the Edit Data in Excel 2016 options, and within the resultant Excel sheet, you can change the Category and/or Series names and also the values they represent. To do so, select the particular cell in the Excel sheet, and overtype (replace) the new value (or name) as required. Figure 6 shows all values of the sample chart changed except the names. Compare Figures 4 and 6.

Figure 6: Chart data changed Tip: Within the smaller Excel window, you can click the icon representing Excel (highlighted in red within Figure 6, above) to launch the complete Excel interface, as shown in Figure 5, earlier on this page.
- When you are done editing names and values within the Excel sheet, go ahead and close Excel. The changes made will automatically reflect within the chart on your PowerPoint slide.
- Save your presentation.


