Several previous tutorials have explored the different drawing
tools in PowerPoint 2010 for Windows, and how they work—we have worked with line drawing tools such as
line,
curve,
freeform,
and scribble.
Using these line tools, you can draw almost anything in PowerPoint that you normally draw in high-end illustration programs.
In this tutorial, you will learn how you can draw a parabola in PowerPoint 2010 using some of these drawing tools.
First of all, what is a parabola? Technically, it is a conic section but to make it easier for you, I'll ask you to visualize the
McDonald's logo with just one conic section rather than two, you can see a representation of a parabola in Figure 1.

Figure 1: A parabola
To draw a parabola in PowerPoint 2010 for Windows, follow these steps:
- Launch PowerPoint 2010 for Windows. Most of the time PowerPoint will open with
a new slide in a presentation. PowerPoint 2010 users can
change the slide layout to Blank by selecting the
Home tab | Layout | Blank option.
- Within the View tab of the Ribbon,
select the Guides checkbox (highlighted in red within Figure 2).
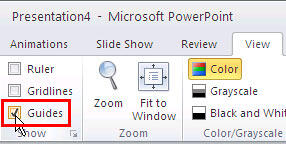
Figure 2: Enable guides on your slide- This will show the guides on the slide, as shown in Figure 3. The default guides (one horizontal
and one vertical guide) work fine for us. So don't worry too much about
adding more guides now.
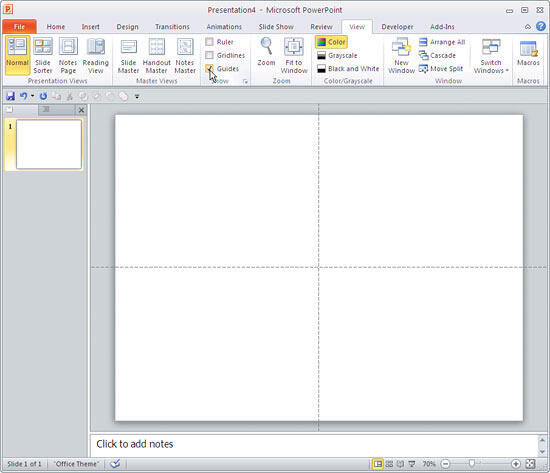
Figure 3 Guides showing on the slide- Within the Home or Insert tab of the Ribbon, click the Shapes button
to view the Shapes gallery that you can see in Figure 4. Select the
Curve shape.
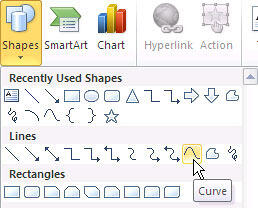
Figure 4 Curve selected- To establish the starting point of the parabola, place the cursor on the position of the horizontal guide, as shown in
Figure 5.

Figure 5: Set the starting point for the parabola- Then click the left mouse button once and move the cursor towards the top-right direction until you encounter the
vertical guide, as shown in Figure 6. Now, click on the vertical guide to establish the top point of your parabola.

Figure 6: Click on the vertical guide to establish the top point of your parabola - Now move the cursor towards the bottom-right of the top point you created and place the cursor on the horizontal guide,
as shown in Figure 7. So that the starting and the ending points of your parabola are on the same horizontal guide.
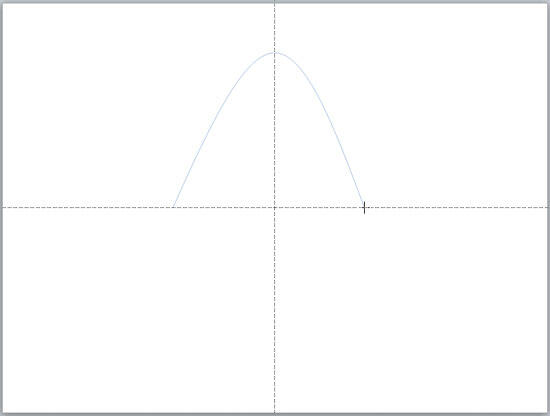
Figure 7: Place the cursor on the horizontal guide to create the endpoint of your parabola- Double click to finish the drawing of your parabola. You'll know your double-click worked if your parabola shows up with
selection handles (see Figure 8).
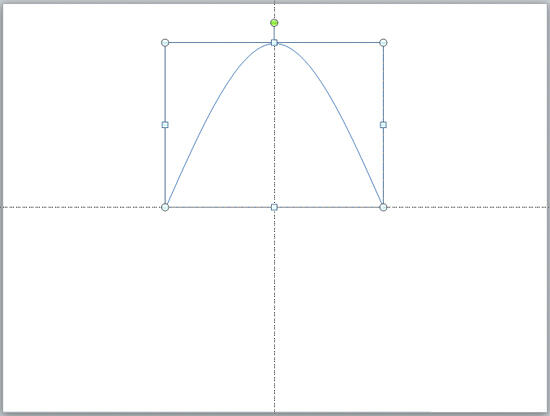
Figure 8: Completed parabola- To edit the parabola right-click on it to bring up the contextual menu you can see in Figure 9. From the menu choose
Edit Points option.
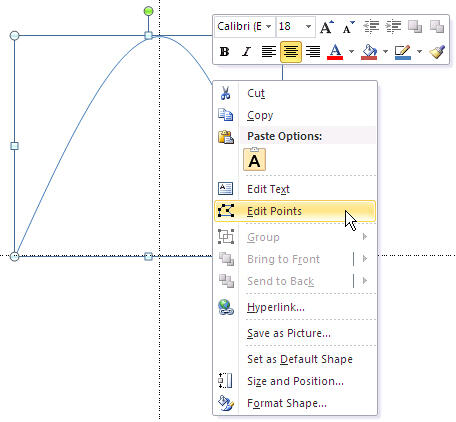
Figure 9: Edit Points option selected- Now you can play with vertexes (points), handles, etc. Learn more about
Edit Points for Shapes in PowerPoint 2010 tutorial.
- You can also change the
line thickness of your parabola, or
change its line color, as required.


