PowerPoint 2013 for Windows provides you with more than one option to insert a table on your slide. These options range from the easy ones that require you to just type in or select the required number of rows and columns, to others such as the Draw Table option that allows you to create a table on your PowerPoint slide directly, in the same way as you would sketch a table with a pen on a paper. Follow these steps to learn more:
- Open your presentation and navigate to the slide where you want to draw the table. Select the Insert tab of the Ribbon, as shown highlighted in red within Figure 1). Within this tab, click the Table button (highlighted in blue within Figure 1) to bring up the Table drop-down gallery as shown in Figure 1.
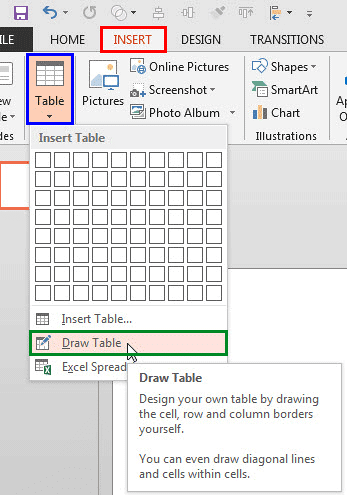
Figure 1: Draw Table option within the Table drop-down gallery - Within the Table drop-down gallery, select the Draw Table option as shown highlighted in green within Figure 1, above. This will change the cursor to a pencil icon as shown highlighted in red within Figure 2, below. Place your cursor on the Slide Area where you want to draw the table, and then click and drag to draw the table's outer borders in the same way as you drag and draw to insert a shape. While drawing, dashed lines will indicate the extent of the table's area (see Figure 2 again).
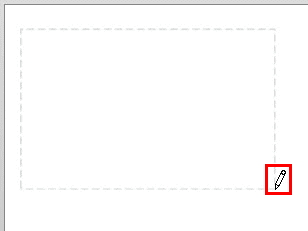
Figure 2: Table being drawn on the slide - When you are happy with the dimensions of your table, let go off the cursor. Your table's outer border will appear, as shown in Figure 3. Do note that there are no cells in the table yet. Rather, you just have one large cell!
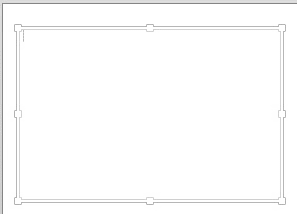
Figure 3: New table drawn without cells - To create table cells, you need to draw vertical and horizontal lines within the table borders. Make sure that your table is selected. Doing so brings up the Table Tools Design and Layout contextual tabs on the Ribbon as shown in Figure 4. Select the Table Tools Design tab (highlighted in red within Figure 4) and click the Draw Table button as shown highlighted in blue within Figure 4.
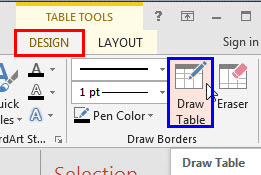
Figure 4: Draw Table button within the Table Tools Design tab - The cursor changes to the pencil icon again. As you can see, we drew a vertical line first. To do that, click carefully within the table near the horizontal border (we clicked near the top-horizontal border) and drag the cursor a little towards the opposite border, as shown in Figure 5, below. A dashed line appears while dragging, as shown in Figure 5.
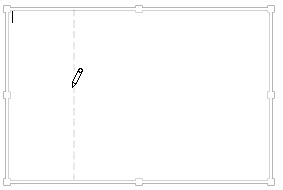
Figure 5: Vertical line being drawn within the table
Note: While drawing lines within the table in PowerPoint 2013 for Windows, make sure you click within the table. Otherwise, you may end up drawing a new table.
- Release the mouse button when you see the dashed line as shown in Figure 5, above. You can see the resultant line in Figure 6, below. Notice that you mouse cursor still sports the pencil icon (refer to Figure 6 again).
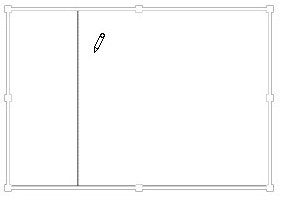
Figure 6: Complete vertical line drawn - Now, to draw a horizontal line, click near the vertical border of the table (we clicked near the left border) of the table carefully and drag the cursor towards the opposite border, as shown in Figure 7, below. You will see a dashed line; notice that the dashed line only appears within the cell where you begin drawing.
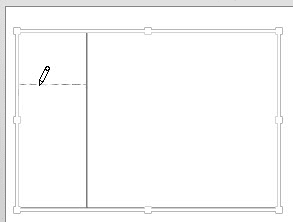
Figure 7: Dashed line has appeared only within the active cell - At this point you have two options:
- Let the mouse button go off to draw the horizontal line only within the active cell, as shown in Figure 8, below.
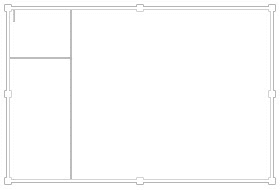
Figure 8: Horizontal line drawn only till the vertical line - Drag it further beyond the vertical line so that the dashed line reaches the opposite border to end up as a complete line across the table, as shown in Figure 9, below.
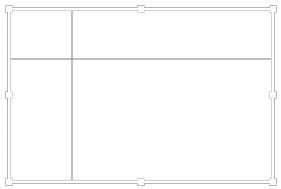
Figure 9: Complete horizontal line drawn
- Similarly, add more horizontal and vertical lines as required. Once all the lines are drawn, click on the Slide Area outside the table to change the cursor back to the arrow pointer icon. Figure 10 shows our sample table after we added few more horizontal and vertical lines.
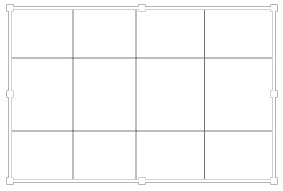
Figure 10: Table added with cells - Since the table is drawn manually, spacing may not be proper. To correct this omission, you can distribute rows and columns. Figure 11 shows our sample table with distributed rows and columns.
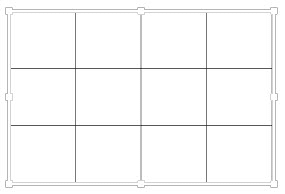
Figure 11: Table with distributed rows and columns - You can also try applying various Table Styles.
- Save your presentation often.


