Learn about doughnut charts, and how you can use them within PowerPoint. Also known as donut charts, these work best when you need something similar to a pie chart, but your data has more than one series.
Author: Geetesh Bajaj
Product/Version: PowerPoint
OS: Microsoft Windows and Mac OS X

A doughnut chart shows the relationship of parts to a whole just like pie chart, but unlike pie chart it can contain more than one data series. In fact, recent versions of PowerPoint include doughnut charts as a subset of pie charts.
You may have often heard that doughnut charts are not easy to read, and that can be true in some cases. Doughnut charts are best suited for smaller amounts of data. If each doughnut in your chart contains twenty values, and you want each of them to possess data labels, then of course, you will end up with a complicated chart that won’t be easy to read.
So, unless you have fewer values and fewer series, you will have to put in a lot of thought before creating doughnut charts. Also, try not to place a detailed doughnut chart within one small area of your slide. Ideally, such charts should take an entire slide on their own.
Also, do consider sunburst charts which may be a better option—they are similar to doughnut charts, but can possess variable thicknesses, and it may also be possible to create charts from data that does not total to a complete 100%.
Scroll down to the bottom of the page to see a sample presentation containing Doughnut chart types and subtypes:
Doughnut charts have the following subtypes:
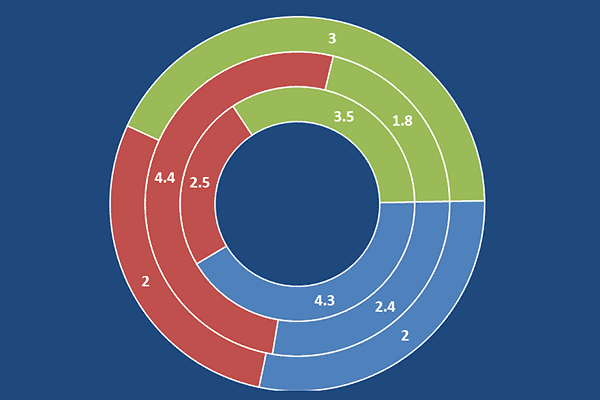
This chart displays data in rings, where each ring represents a data series, as shown in Figure 1, below. If percentages are displayed in data labels, each ring will total 100%.

Figure 1: A doughnut or donut chart
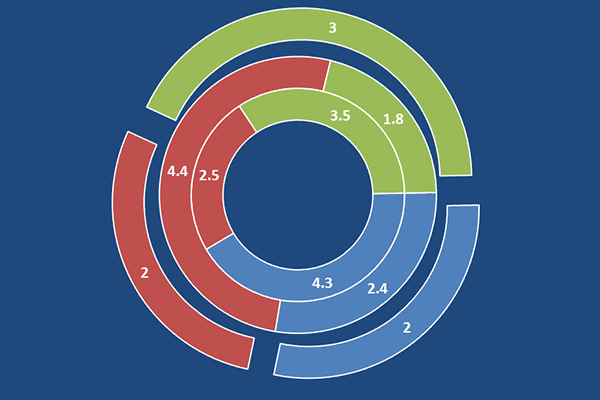
Exploded doughnut charts display the contribution of each value to a total while emphasizing individual values, as shown in Figure 2, below. They can contain more than one data series.

Figure 2: Exploded doughnut chart in PowerPoint
Doughnut Chart Type in PowerPoint Sample Presentation:
Click below to view on Slideshare
Click below to view on YouTube
10 14 10 - PowerPoint Chart Types: Doughnut Chart Type in PowerPoint (Glossary Page)
You May Also Like: Formulate A Winning Presentation: Conversation with Margy Schaller | Cabbage PowerPoint Templates


Microsoft and the Office logo are trademarks or registered trademarks of Microsoft Corporation in the United States and/or other countries.