Indezine Logo


Creating Charts Using Excel Data in PowerPoint 2013 for Windows

Learn how to use existing Excel data to create charts in PowerPoint 2013 for Windows. This process can save you time spent on needlessly duplicating data sources.


Author:

Product/Version: PowerPoint 2013 for Windows

OS: Microsoft Windows 7 and higher


Learn PowerPoint

How do I convert word lists in Excel to PowerPoint slides?


Most users start from scratch when inserting charts in PowerPoint slides. This process brings up an instance of Excel, and indeed you can type in your own data to replace Excel's dummy data. However, what if you have existing data within an Excel sheet? Why can't you use that data to create your PowerPoint chart? Why does PowerPoint not provide an easy option to use your existing Excel sheets? Where does the sheet with all your chart data reside? And can't you bring in your own data to that sheet in a way that does not make you type everything all over again? That's a bunch of very genuine questions! This article will attempt to provide you with some answers.

Solving the Missing Excel Sheet Mystery

The Excel sheet that contains the dummy data has no real name or location. Even though it's an Excel file, it lives as part of the PowerPoint presentation that includes a chart. So don't try looking for that Excel sheet on your computer's folders. It just doesn't exist there!

First of all, a default chart inserted in PowerPoint 2013 for Windows may look similar to the one you see in Figure 1, below.
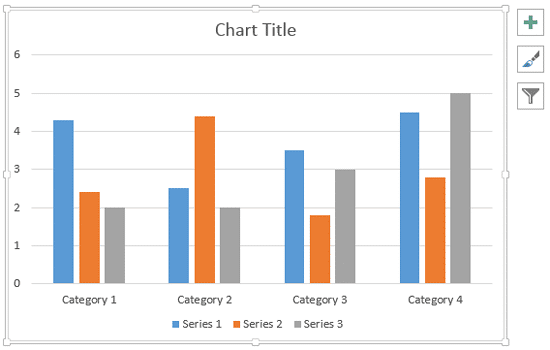
A new chart inserted in PowerPoint
Figure 1: A new chart inserted in PowerPoint

All data that works behind the scenes for any chart in PowerPoint 2013 is essentially stored in an Excel sheet, as shown in Figure 2, below. You see this Excel sheet the first time you insert a chart.
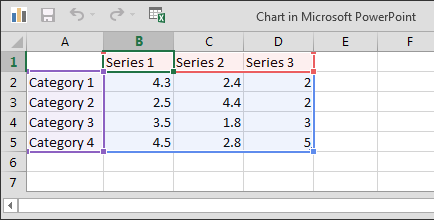
Dummy chart data within an instance of the Excel sheet
Figure 2: Dummy chart data within an instance of the Excel sheet

Bring up the Excel Datasheet

Want to bring up this Excel sheet that contains data after your chart has already been created? Explore our Edit Chart Data in PowerPoint 2013 for Windows tutorial.

You can change dummy data to your own values manually. Even better, you can bring in data that's already on an existing Excel sheet using this step-by-step process in PowerPoint 2013 for Windows:
  1. Insert a new chart on your slide as shown in Figure 1, previously on this page. Thereafter, make sure that the instance of Excel sheet containing the chart's dummy data is visible, as shown in Figure 2, previously on this page.
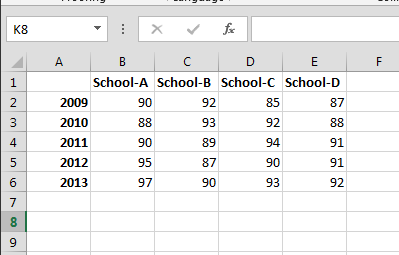
  2. Now, open the Excel sheet containing data, as shown in Figure 3, below. Note that this is a separate Excel sheet that already existed outside of PowerPoint.
  3. Data to be used for chart
    Figure 3: Data to be used for chart
  4. As you can see in this case (compare Figures 2 and 3), the dummy data and the actual data are a bit different. It does not matter if the values were different. What matters is that:
    1. Our data contains four series, and the dummy data has only three series.
    2. Our data contains five categories, and the dummy data has only four categories.
  5. The above instances are just examples. We wanted a scenario where the dummy data and the actual data may have a different number of series and categories.
  6. Before we can paste in the content from our Excel sheet to the one that includes the dummy data, we need to add one extra series and also an extra category within our dummy data.
  7. Add new categories or series, as explained in our Adding and Deleting Chart Series and Categories in PowerPoint 2013 for Windows tutorial. We added one extra row and one extra column, as shown in Figure 4.
  8. Chart Categories and Series added
    Figure 4: Chart categories and series added
  9. Conversely, if your Excel data includes fewer series or categories, you will need to delete that many rows/columns from the dummy data. This is again explained in our Adding and Deleting Chart Series and Categories in PowerPoint 2013 tutorial.
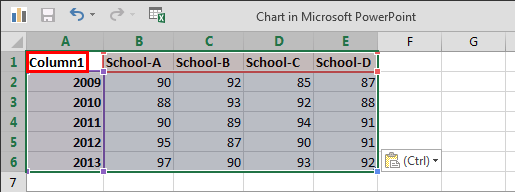
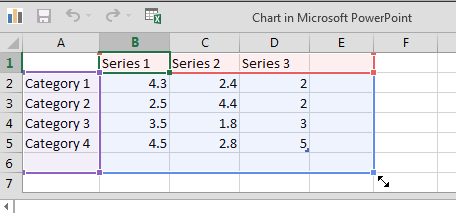
  10. Once your actual data and dummy data have the same number of rows and columns, copy the actual data from your Excel sheet and paste to overwrite the dummy data, as shown within the results in Figure 5, below.
  11. Dummy data overwritten with actual data
    Figure 5: Dummy data overwritten with actual data
  12. The Unnecessary Cell

    Do you see that extra column heading named Column1, shown as highlighted in red within Figure 5? This cell does not show up on the chart. If you don't want to see this text, feel free to delete it within your Excel sheet.
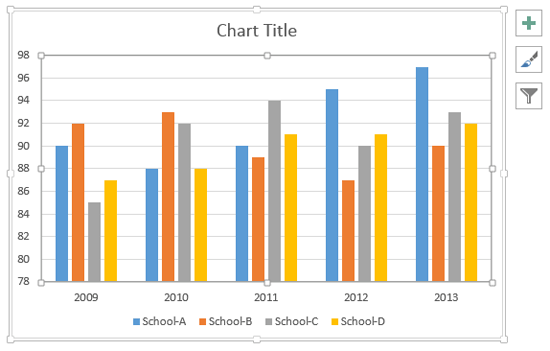
  13. Now, explore your PowerPoint slide. You will see the chart on your slide reflecting the actual data. Figure 6 shows our sample chart after we copied and pasted the actual data over the dummy data (compare Figures 1 and 6).
  14. Chart reflecting the new data
    Figure 6: Chart reflecting the new data
  15. Save your presentation often.

See Also:

Chart Data: Creating Charts Using Excel Data (Glossary Page)

Creating Charts Using Excel Data in PowerPoint 2011 for Mac

You May Also Like: 6 Reasons Why Your PowerPoint Presentations (Still) Look Boring | Biofuels PowerPoint Templates


Popular Posts

Add Pattern Fills to Shapes in PowerPoint 2010 for Windows
Add pattern fills to shapes in PowerPoint 2010 for Windows.

Gradient Fills for Text in PowerPoint 2013
Learn how to add gradient fills to selected text in PowerPoint 2013.

Formatting Outlines for Shapes (Dashes) in PowerPoint 2013 for Windows
Learn how to apply the dash attribute to shape outlines in PowerPoint 2013 for Windows.

Change the Unit of Measurement in Windows 10
Learn how to change the unit of measurement from US to Metric, and vice versa in Windows 10.


Ebook PowerPoint Keyboard Shortcuts

PowerPoint Keyboard Shortcuts and Sequences Ebook

PowerPoint 365, 2019, 2016, 2013, 2011, 2010, 2007 and 2003 for Windows

PowerPoint 365, 2019, 2016 and 2011 for Mac

PowerPoint for the Web on Windows and Mac

Have you ever used keyboard shortcuts and sequences in PowerPoint? Or are you a complete keyboard aficionado? Do you want to learn about some new shortcuts? Or do you want to know if your favorite keyboard shortcuts are documented?

Go and get a copy of our PowerPoint Keyboard Shortcuts and Sequences ebook.


Microsoft and the Office logo are trademarks or registered trademarks of Microsoft Corporation in the United States and/or other countries.

Home | PowerPoint | Photoshop | PowerPoint Templates | PowerPoint Tutorials | Blog | Notes | Ezine | Media Kit | Feedback | Site Map | About Us | Contact Us

Link to Us | Privacy | Testimonials

PowerPoint Backgrounds | Christian PowerPoint Backgrounds | Business PowerPoint Presentation Templates

Plagiarism will be detected by Copyscape

©2000-2023, . All rights reserved.