A chart title of course is something that describes your chart. And PowerPoint charts do have an option to use a placeholder to contain this Chart Title. However, before you go ahead and use this option, you must decide if you need this chart title placeholder or not. Here are some guidelines that will help you make that decision:
- If you have just one chart on your slide and nothing else, your slide's title can be the title of your chart and no separate chart title placeholder is required.
- If you need both, a title and a sub-title for your chart, the slide's title can be your chart title, and the Chart Title placeholder can contain the sub-title.
- When there are multiple charts on a slide, then each chart will benefit from a separate title.
Now that we have explored these guidelines on chart title, let us explore how you can add and position them: First of all, you should have a chart inserted on your PowerPoint slide. Then, follow these steps to learn more in PowerPoint 2013 for Windows:
- When you insert a chart in PowerPoint 2013 for Windows, you will see the default title, as shown highlighted in red within Figure 1, below.
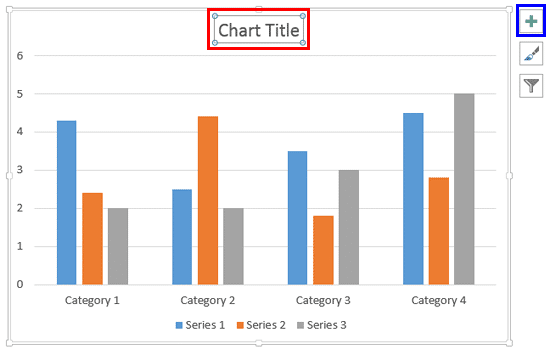
Figure 1: Chart title enabled by default in PowerPoint 2013 - If you can't see the text chart title as shown in Figure 1, above, click the Chart Elements button indicated by the plus sign highlighted in blue within Figure 1, above. Doing so opens the Chart Elements gallery, shown in Figure 2, below. Within the Chart Elements gallery, make sure that the Chart Title check-box is selected as shown highlighted in red within Figure 2. This step will enable the Chart Title placeholder in your chart as shown highlighted in red within Figure 1, above.
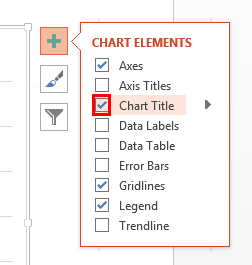
Figure 2: Chart Elements gallery - Once the default Chart Title is made visible, overwrite the text Chart Title boilerplate text with your own text. To do that first select the entire dummy text, Chart Title as shown in Figure 3, below.
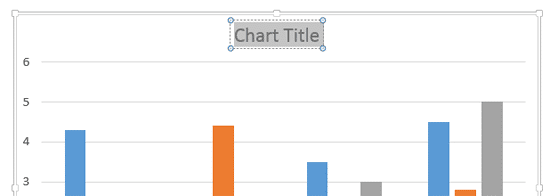
Figure 3: Dummy chart title text selected - Then, type the actual chart title. In Figure 4, below you can see that we changed the default name to Export Report as shown highlighted in red within Figure 4.
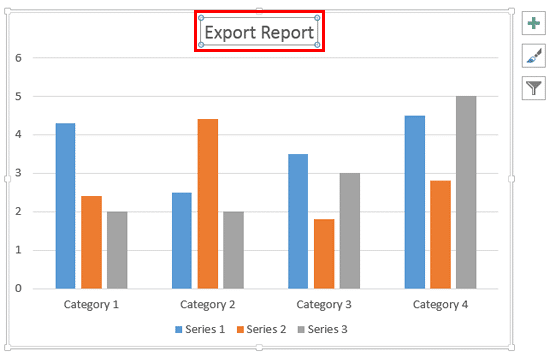
Figure 4: Chart title text changed - You can also change the position of the chart title. To do so, first click the Chart Elements button indicated by the plus sign highlighted in red within Figure 5, below. Doing so opens the Chart Elements gallery. Within the Chart Elements gallery, hover your cursor over the Chart Title option. This action brings up a right-arrow as shown highlighted in blue within Figure 5. Click this right-arrow to open the Chart Title sub-gallery shown highlighted in green within Figure 5 that includes various position options for the chart title.
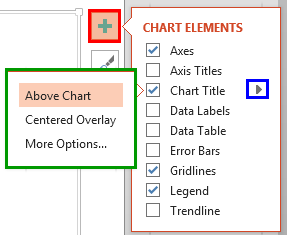
Figure 5: Chart title sub gallery - Let us explore options within the Chart Title drop-down gallery:
A. Above Chart
- Selecting this option positions the chart title above the chart, as previously shown highlighted in red within Figure 4, above.
B. Centered Overlay
- Works similar to the Above Chart option except that it places the chart title overlapping the Plot Area, as you can see highlighted in red within Figure 6, below.
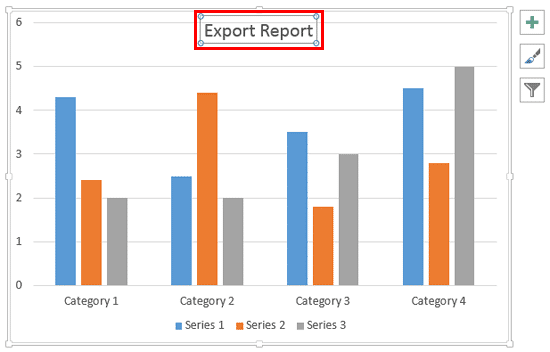
Figure 6: Chart title added overlapping the Plot Area C. More Options
- Selecting this option opens the Format Chart Title Task Pane, as shown in Figure 7, below.
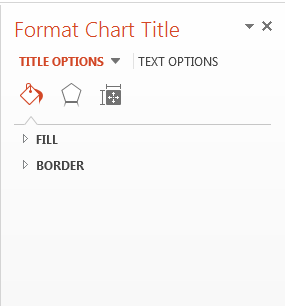
Figure 7: Format Chart Title Task Pane - Options within this Format Chart Title Task Pane work the same way as they do for Chart Data Label. In our Format Data Label Options for Charts in PowerPoint 2013 tutorial you can get more info about these options. Read Step 2 onwards within that tutorial.
Place Your Chart Title Anywhere You Want
- Want your chart title to be placed below the chart for some reason? It's easy, just drag the Chart Title placeholder to anywhere you want.
- Add and format the chart title as required. Save your presentation often.


