Learn about chart gridlines in PowerPoint 2011 for Mac. Gridlines can help audiences understand charts better, especially if the chart is crowded.
Author: Geetesh Bajaj
Product/Version: PowerPoint 2011 for Mac
OS: Mac OS X
Horizontal and vertical gridlines are the lines that span wide and tall within the chart's Plot Area. These gridlines originate from one of the axes, that makes the data easier to comprehend for the viewer. Gridlines may emerge from the horizontal and vertical axes, although by default, you can see only Horizontal gridlines on the chart. Gridlines are shown in Figure 1, below in which we have shown the Horizontal gridlines in orange color and the Vertical gridlines in purple. However, remember that this is not the default colors of gridlines.
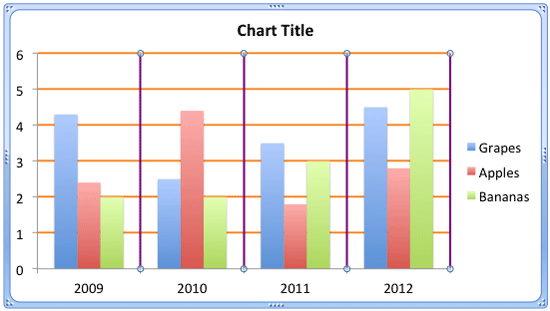
Figure 1: Horizontal and Vertical gridlines
Here are a few points to be considered when you work with Gridlines in PowerPoint 2011 for Mac:
In this tutorial, let us learn about Gridline options, and also how to turn on the Vertical chart gridlines that are not visible on new, inserted charts.
Let us start with turning on the Vertical Gridline:


Now, let us explore options available within the Horizontal Gridlines or the Vertical Gridlines sub-menus. Both these sub-menus contain the same options, as shown within the sub-menu in Figure 4, below.
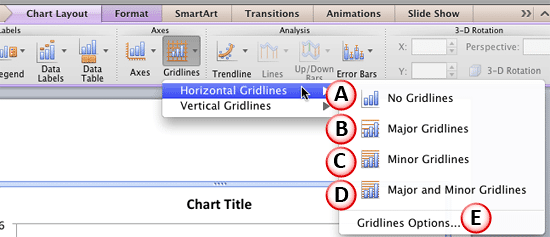
Figure 4: Horizontal Gridlines editing options
These options are explained below as they are marked in Figure 4, above:
This option is used to remove gridlines from the chart, as shown in Figure 5, below.
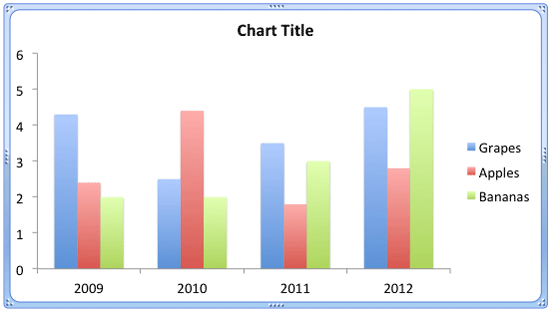
Figure 5: Chart with no Gridlines
This option enables only the Major Gridlines, as shown in Figure 6, below.
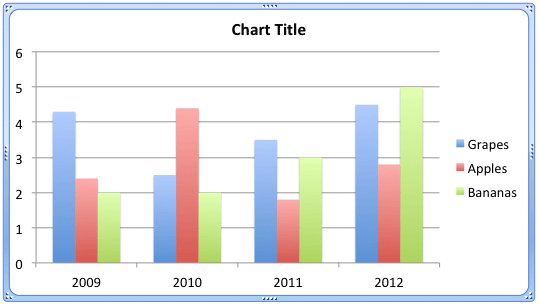
Figure 6: Chart with only Major (Horizontal) Gridlines
Used to show only Minor Gridlines, as shown in Figure 7, below.
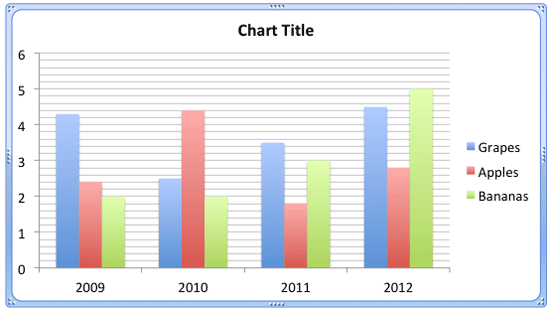
Figure 7: Chart with only Minor (Horizontal) Gridlines
You can make both Major and Minor Gridlines visible on the chart using this option as shown in Figure 8, below.
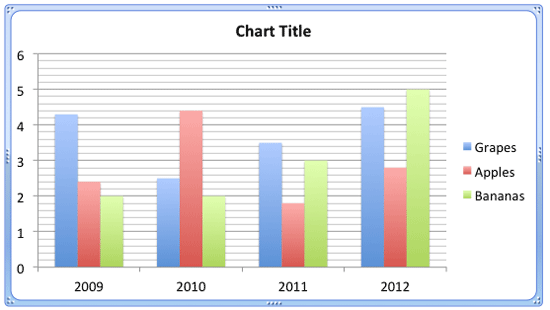
Figure 8: Chart with both Major Minor (Horizontal) Gridlines
Select this option to summon the Format Gridlines dialog box that you see in Figure 9. To learn more about the options in this dialog box, refer to our More Gridline Options for Charts in PowerPoint 2011 for Mac tutorial.
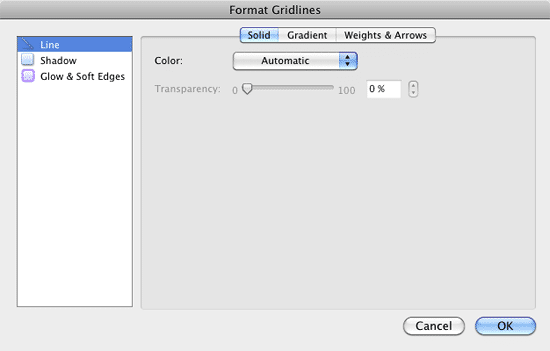
Figure 9: Format Gridlines dialog box
See Also:
Chart Gridlines: Chart Gridlines (Glossary Page)
Chart Gridlines in PowerPoint 2013 for Windows
You May Also Like: Creating Multilingual Presentations: Conversation with Jude Barak | Emotions PowerPoint Templates


Microsoft and the Office logo are trademarks or registered trademarks of Microsoft Corporation in the United States and/or other countries.