There may be times when you need to show both the chart and the underlying data that created the chart. To make this possible, you can use PowerPoint's Data Table option. This way, not only you get the pictorial representation of the values, but you also get to show the same values in the form of a table right below the chart.
Follow these steps to learn more in PowerPoint in 2013 for Windows:
- Open your presentation in PowerPoint 2013 for Windows and select the required chart, as shown in Figure 1, below.
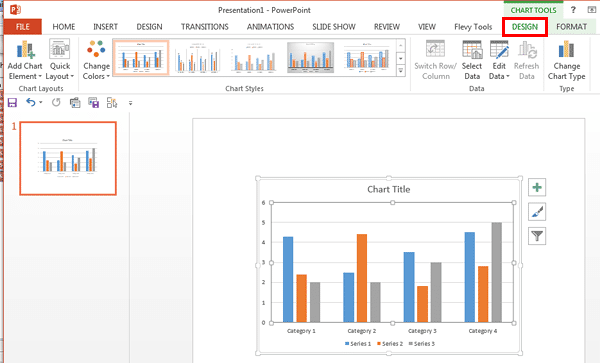
Figure 1: Chart selected - Doing so brings up two Charts Tools contextual tabs of the Ribbon. Select the Design tab, highlighted in red within Figure 1, above. Then, click the Add Chart Element button, shown highlighted in red within Figure 2, below. This step opens a drop-down gallery as shown in Figure 2. Within this drop-down gallery, select the Data Table option to open a sub-gallery which includes various options for the Data Table, highlighted in blue within Figure 2.
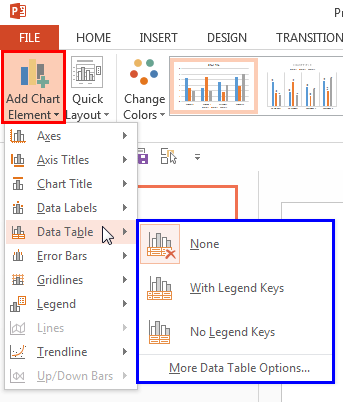
Figure 2: Data Table sub-gallery - Alternatively, you can select the chart and click the Chart Elements button, which is the plus sign highlighted in red within Figure 3, below. This step opens the Chart Elements gallery. Within the Chart Elements gallery, hover your cursor over the Data Table option. This brings up a right-arrow as shown highlighted in blue within Figure 3. Click this right-arrow to open the Data Table sub-gallery, highlighted in green within Figure 3, which includes various options for the Data Table.
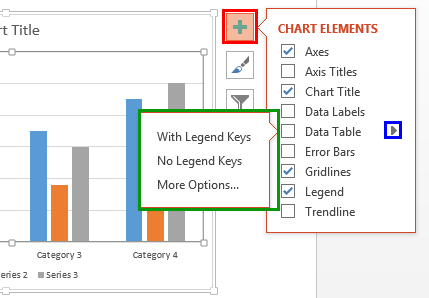
Figure 3: Data Table options - Let us explore options within the Data Table sub-gallery shown in Figure 2, previously on this page:
A. None
- Selected by default, this option removes any existing Data Table from the chart. Your chart will appear as shown previously in Figure 1 on this page.
B. With Legend Keys
- Adds a Data Table below the chart with each Series name accompanied by its Legend Key (color block) in the Data Table, as shown highlighted in red within Figure 4, below.
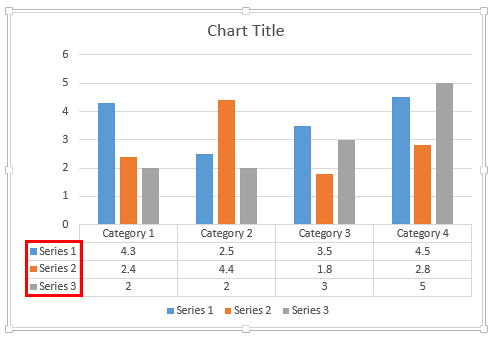
Figure 4: Data Table with Legend Key C. No Legend Keys
- Adds a Data Table to the chart with the Series names not showing any Legend Keys (color blocks). Figure 5 shows Data Table added, highlighted in red within Figure 5, below.
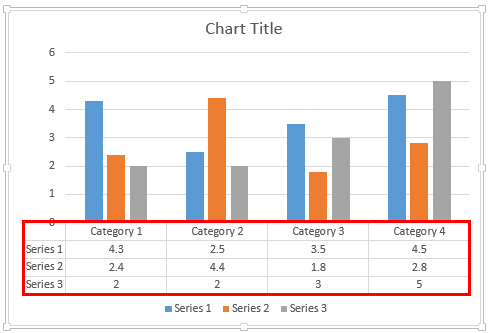
Figure 5: Data Table without Legend Keys added Note: Hover the cursor over any top three options within the
Data Table sub-gallery to see a
Live Preview.
D. More Data Table Options
- Summons the Format Data Table Task Pane that provides you with various options to customize the appearance of your Data Table. This is explained in our Data Table Options for Charts in PowerPoint 2013 for Windows tutorial.
- Save your presentation often!


