Everything on a chart within PowerPoint 2013 for Windows is placed on top of the Chart Area. This essentially is the entire area that encompasses your chart. Thus, the Chart Area is that part of your chart which is placed beneath all other chart elements. Look at Figure 1 below, where you can see the Chart Area colored in pale orange, which is surrounded by selection handles.
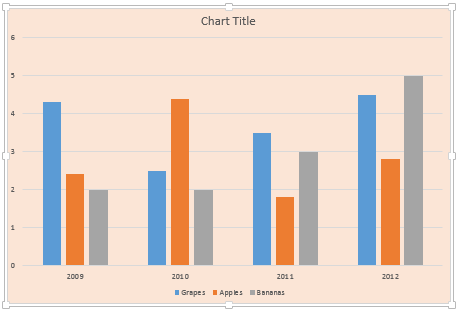
Figure 1: Chart Area
By default, the Chart Area doesn't possess any fill or any kind of formatting unless you have used a particular Chart Style. Even though this default status works well, you can opt to format as required. You can change the fill, border, and effect of the Chart Area, change the size and properties of the chart, and also change the font attribute.
Follow these steps to explore more in PowerPoint 2013 for Windows:
- Select the chart that you want to format the Chart Area for. If you don't have a chart, insert a new chart in your slide.
- Now, carefully right-click the Chart Area. From the resultant menu, select the Format Chart Area option, highlighted in red within Figure 2.
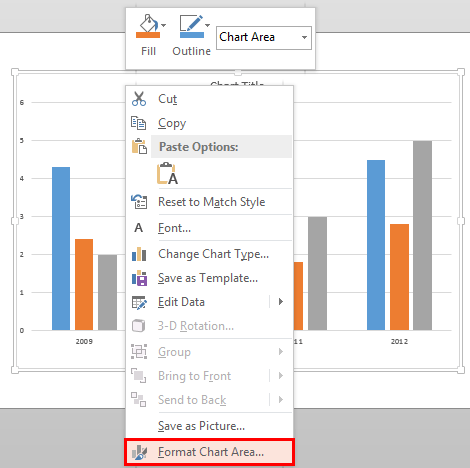
Figure 2: Format Chart Area option - Doing so opens the Format Chart Area Task Pane as shown in Figure 3. In this Task Pane, you'll find the Chart Options and Text Options tabs, highlighted in red within Figure 3. These two tabs provide you with all Chart Area formatting options.
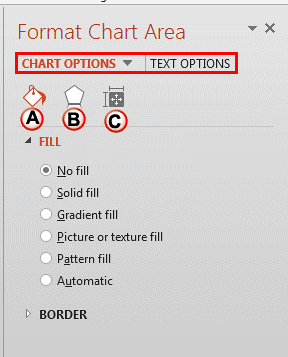
Figure 3: Chart Options within Format Chart Area Task Pane - Let us start with exploring the options within the Chart Options tab, as marked in Figure 3.
A. Fill & Line
- Includes various options that are used to edit fill and border of the Chart Area. Learn more in our Fill and Line options for Chart Area in PowerPoint 2013 tutorial.
B. Effects
- You can apply an effect such as a Bevel or a Shadow etc. to the Chart Area. To explore more, refer to our Effect Options for Chart Area in PowerPoint 2013 tutorial.
C. Size & Properties
- You can reposition your chart on the slide, and also add an Alt text for your Chart. Get more info in our Size & Properties Options for Chart Area in PowerPoint 2013 tutorial.
- The Text Options tab of the Format Chart Area Task Pane provides you with the text editing options for your Chart Area, as shown in Figure 4.
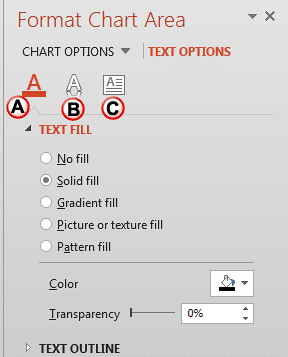
Figure 4: Text Options tab of the Format Chart Area Task Pane - Let us explore the options within the Text Options tab, as marked in Figure 4.
A. Text Fill & Outline
- Change the Text fill and outline of your chart text as explained in our Text Fill & Outline Options for Chart Area in PowerPoint 2013 tutorial.
B. Text Effects
- Choose from various text effects to make your chart text stand apart. For more information, refer to our
Text Effects Options for Chart Area in PowerPoint 2013 tutorial.
C. Textbox
- Although you can find some options here (see Figure 5, below), changes made here do not reflect in any way within the actual Chart Area.
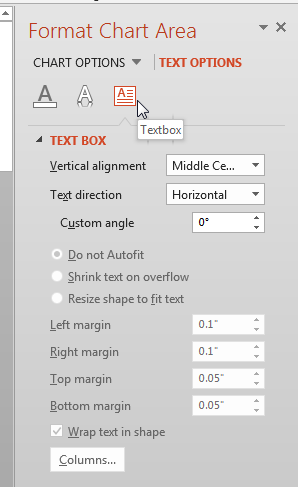
Figure 5: Textbox Options within the Chart Area Task Pane - Select the required option and format the Chart Area as required.
- Save your presentation often.


