Learn about formatting fonts within charts in PowerPoint 2010 for Windows. You can change font, font size, and other formatting attributes within PowerPoint charts.
Author: Geetesh Bajaj
Product/Version: PowerPoint 2010 for Windows
OS: Microsoft Windows XP and higher
Even though charts are a visual medium, they still contain plenty of text in the form of data labels, titles, legend, axis labels, etc. Whenever, you insert a new chart in PowerPoint, colors and fonts based on the active Theme of the presentation are used.
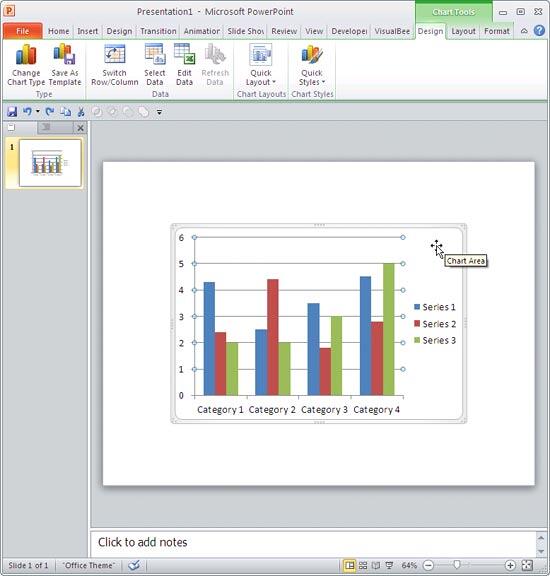
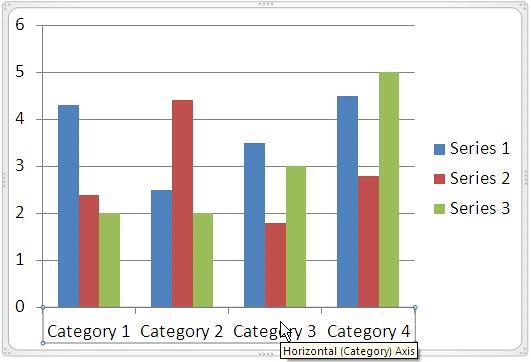
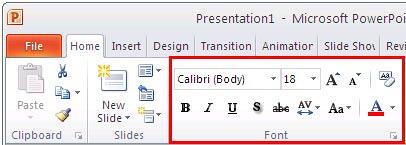
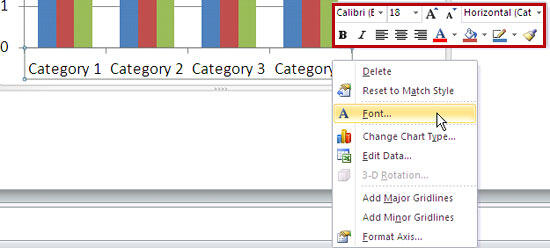
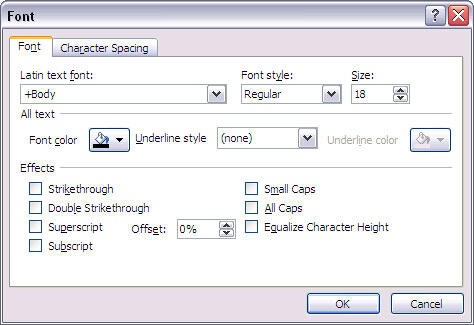
In this tutorial, you are going to learn how you can change the font and use other text options for charts in PowerPoint 2010 for Windows:
See Also:
Advanced Chart Techniques: Changing Fonts and Other Text Options for Charts (Glossary Page)
Changing Fonts and Other Text Options for Charts in PowerPoint 2013 for Windows
Changing Fonts and Other Text Options for Charts in PowerPoint 2011 for Mac
Changing Fonts and Other Text Options for Charts in PowerPoint 2007 for Windows
Changing Fonts and Other Text Options for Charts in PowerPoint 2003 and 2002 for Windows
You May Also Like: How Beatboxing Can Help Us Master Successful Business Communication: by Ally Yates | Almonds PowerPoint Templates


Microsoft and the Office logo are trademarks or registered trademarks of Microsoft Corporation in the United States and/or other countries.