Change major and minor units of the value axis in PowerPoint 2007 for Windows. We also explore other value axis options.
Author: Geetesh Bajaj
Product/Version: PowerPoint 2007 for Windows
OS: Microsoft Windows XP and higher
The significance of any chart lies in its ability to visually represent complex data as a trend that an audience can easily grasp. So if you create a complex chart with too much detail, you might be ironically creating confusion out of simplicity, even if you are not aware that you are doing this! One of the easiest ways in which you can make your chart look simpler and less intimidating is by using fewer major units in the Y axis, and if that sounds like something that's difficult for you to understand, then stop worrying and start following this easy tutorial. This tutorial is for PowerPoint 2007 and will also work in PowerPoint 2010 for Windows, users of PowerPoint 2002 and 2003 can follow this similar tutorial.
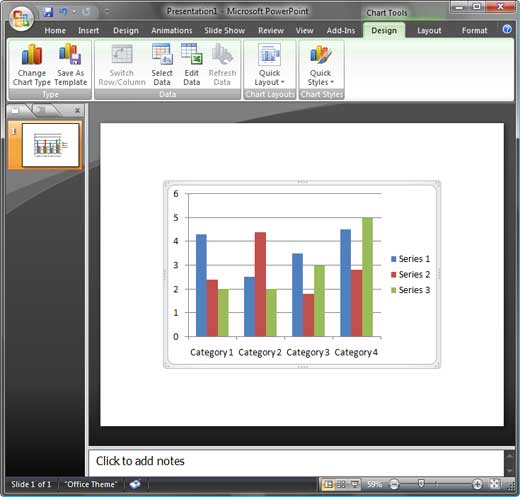
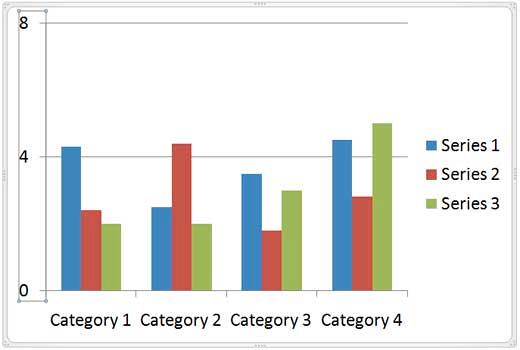
If you want, you can follow this tutorial with us, all you need is a slide with the default column chart inserted in PowerPoint 2007 or 2010.
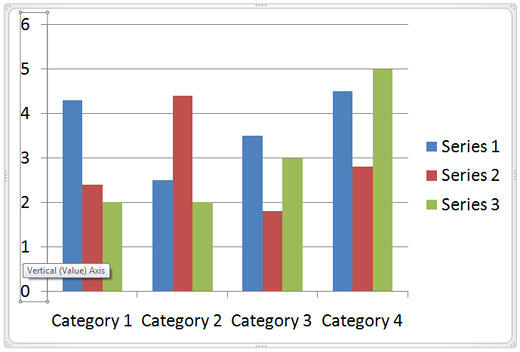
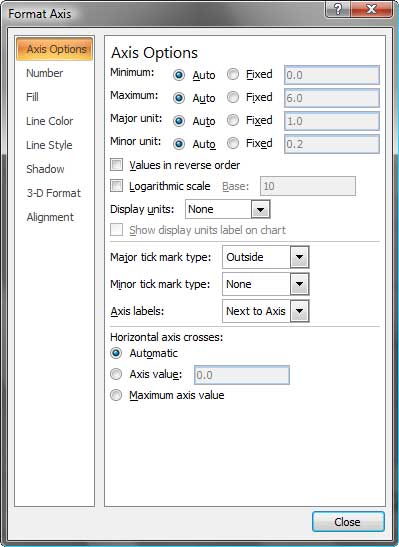
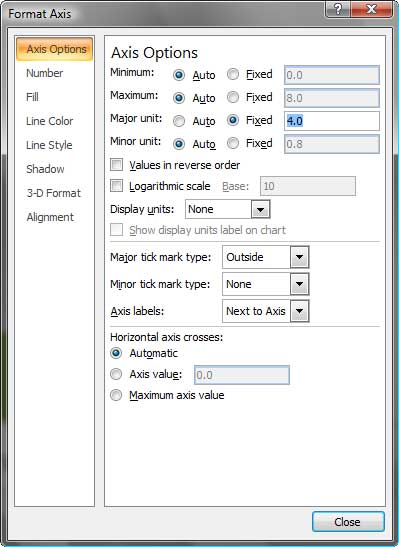
Follow these steps to change major unit of Y axis in PowerPoint 2007 or 2010.

10 08 05 - Chart Axes: Change Major and Minor Units of Value Axis (Glossary Page)
Change Major and Minor Units of Value Axis in PowerPoint 2013 for Windows
Change Major and Minor Units of Value Axis in PowerPoint 2011 for Mac
Change Major and Minor Units of Value Axis in PowerPoint 2010 for Windows
Change Major and Minor Units of Value Axis in PowerPoint 2003 and 2002 for Windows
You May Also Like: What’s the Best Advice for a Presentation Designer? Good Questions. | Newspaper PowerPoint Templates


Microsoft and the Office logo are trademarks or registered trademarks of Microsoft Corporation in the United States and/or other countries.