Learn how to change the order in which chart data series are displayed in PowerPoint 2013 for Windows. This task is so much easier if you follow the steps in order.
Author: Geetesh Bajaj
Product/Version: PowerPoint 2013 for Windows
OS: Microsoft Windows 7 and higher
Typically the Data Series of a chart in PowerPoint is displayed in the exact sequence in which it is contained within the Excel sheet. If you want to change the order of the Data Series within the chart, you access the Excel sheet containing the chart data and reorder the columns representing the Data Series. But, what if you don't want to alter the Excel data, and want to reorder the Data Series within the PowerPoint chart itself? That's doable, and this tutorial will explain the process.
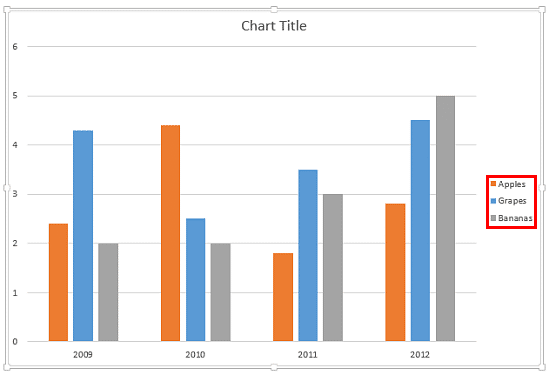
Our Data Series within the sample chart below are grapes, apples, and bananas, and these show up in exactly the same order within the chart, as shown highlighted in red within Figure 1, below.
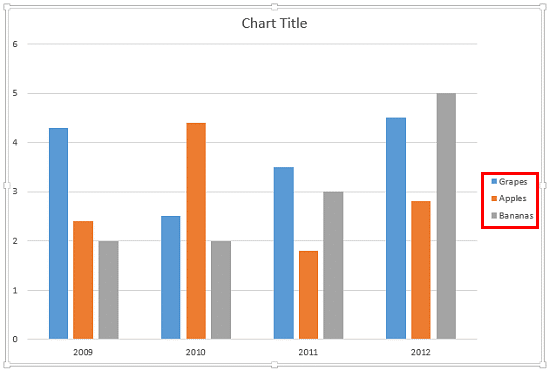
Figure 1: Initial position of the Chart Data Series
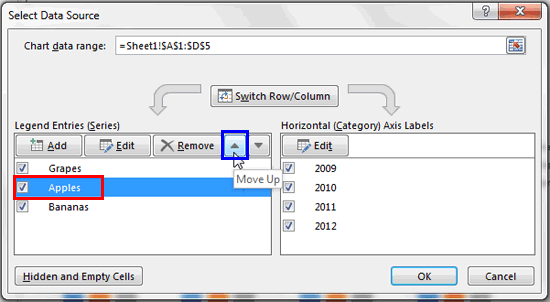
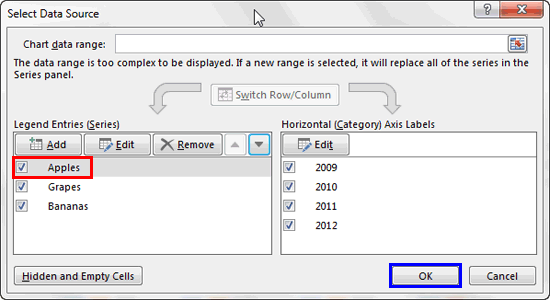
Now, what if we want to change this order to apples, grapes, and bananas without bringing up the Excel data? Yes, we can make these changes within PowerPoint.
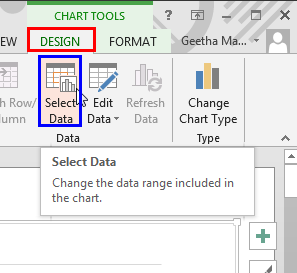
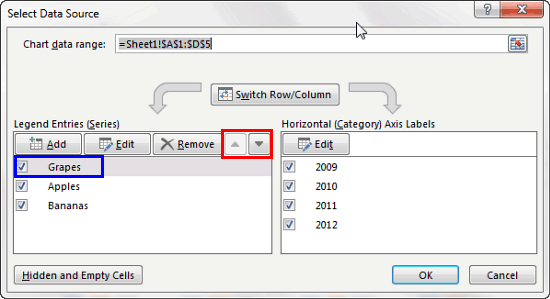
To start with, you need a chart inserted and selected within PowerPoint 2013 for Windows as shown in Figure 1, above. Then, follow these steps:
See Also:
Chart Data: Change Order of Chart Data Series (Glossary Page)
Change Order of Chart Data Series in PowerPoint 2011 for Mac
You May Also Like: The Ultimate Presentation Checklist (Infographic): by Adam Chapman | Television PowerPoint Templates


Microsoft and the Office logo are trademarks or registered trademarks of Microsoft Corporation in the United States and/or other countries.