Change major and minor units of the value axis in PowerPoint 2010 for Windows. We also explore other value axis options.
Author: Geetesh Bajaj
Product/Version: PowerPoint 2010 for Windows
OS: Microsoft Windows XP and higher
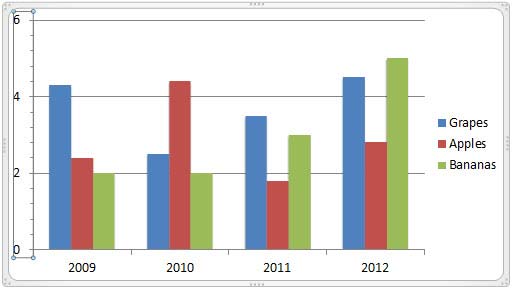
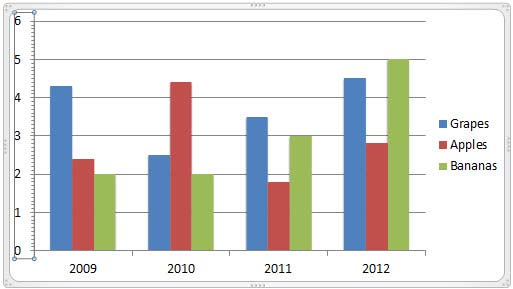
While learning about chart axes, you will come across two terms, major and minor units. These are the intervals at which the axis spaces itself. As the name suggest, you can choose to space the axis at two levels: major and minor. Look at Figure 1, below and you'll see a chart that has both major and minor units displayed on the value axis. All units pointed with blue arrows are major, and green arrows point to minor units.
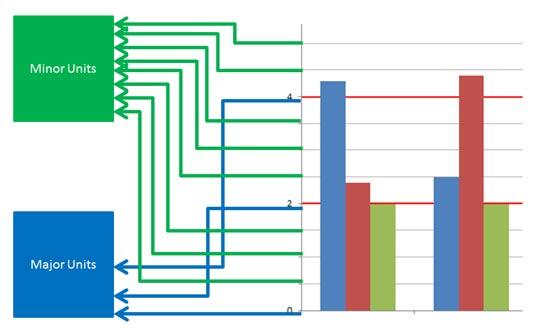
Figure 1: Major and minor units displayed on the value axis
By default, PowerPoint sets the major and minor units on its own. Many times, this may be exactly what you need. At other times, you may want to set your own intervals for the major and minor units for several reasons. Before you do so, a word of caution: do remember that any of these changes can have three implications:
Values that you see placed on the value axis reflect the major units you choose. However, any changes you make to minor units do not influence the displayed values, since values of minor units are not typically displayed on the axis.
Tick marks you see change depending upon intervals you choose for both major and minor units. Of course, it all depends upon whether you have opted to display tick marks or not. Refer to our Tick Marks on Chart Axes in PowerPoint 2010 tutorial to learn more.
Gridlines shown change as well. Again, the appearance of these gridlines will be influenced by whether you have made them visible or not.
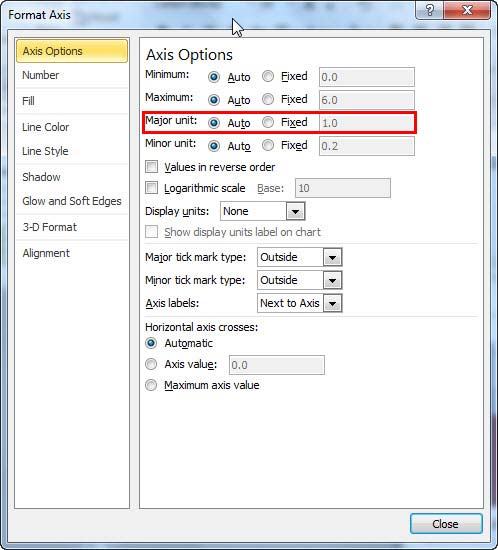
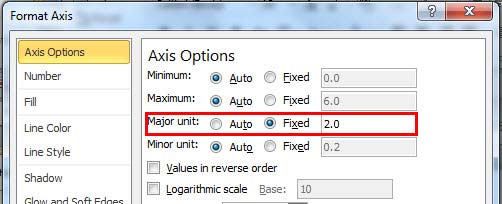
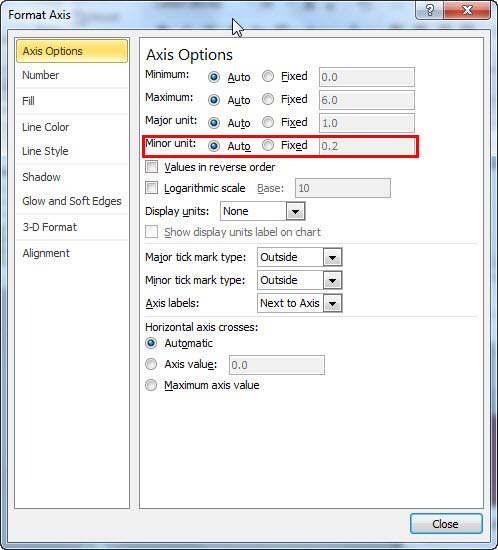
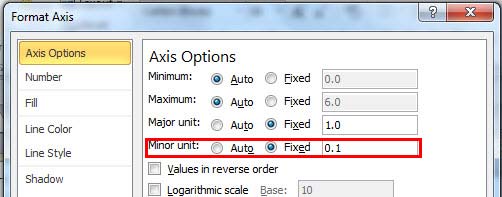
The major unit influences spacing between major tick marks on the value axis. Similarly, the minor unit influences spacing between minor tick marks on the value axis. By default these values are automatically decided by the Minimum and Maximum scale values on the value axis. Still, you can change them to suit your needs, as explained in this tutorial.
Follow these steps to learn about changing major and minor units within chart axes in PowerPoint 2010 for Windows:
10 08 05 - Chart Axes: Change Major and Minor Units of Value Axis (Glossary Page)
Change Major and Minor Units of Value Axis in PowerPoint 2013 for Windows
Change Major and Minor Units of Value Axis in PowerPoint 2011 for Mac
Change Major and Minor Units of Value Axis in PowerPoint 2007 for Windows
Change Major and Minor Units of Value Axis in PowerPoint 2003 and 2002 for Windows
You May Also Like: How to Use Your Voice to Engage Your Audience When Presenting (Online or In-Person) | Finance PowerPoint Templates


Microsoft and the Office logo are trademarks or registered trademarks of Microsoft Corporation in the United States and/or other countries.