In a chart, text used to label the chart axis is called the Axis Title. All chart types other than Pie and Doughnut have axes and although Radar charts have an axis, there is no provision to add axis titles for them. In all other chart types such as Column, Line, etc., axis titles don't show up by default. You have to make them visible first, and then edit them as required. That's exactly what you are going to learn in this tutorial.
Before you get started, you should have a chart inserted on your PowerPoint slide. We used a column chart for this example. You can also use any other chart type that allows axis titles. If you don't know how to insert a chart, refer to our Inserting Charts in PowerPoint 2010 for Windows tutorial. You can also change the chart type from one to another. Do make sure your chart type supports axis titles.
Follow these steps to work with axis titles in PowerPoint 2010 for Windows:
- Select the chart on your slide as shown in Figure 1, below. This action displays the Chart Tools Design, Layout, and Format tabs on the Ribbon area. Select the Chart Tools Layout tab, as shown highlighted in red within Figure 1.
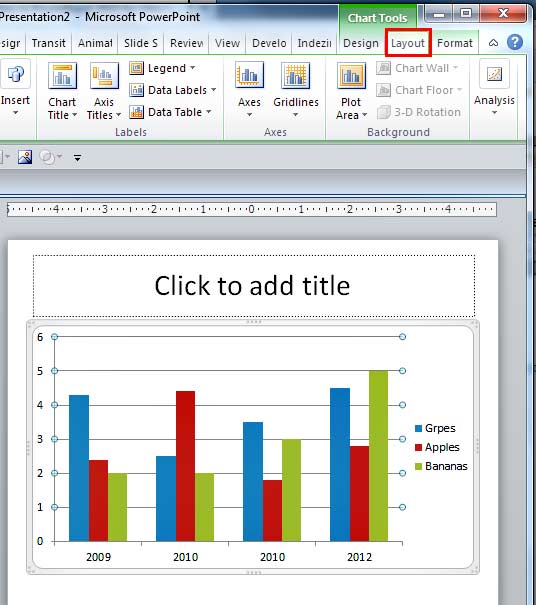
Figure 1: Chart Tools Layout tab selected Contextual Tabs
- The Chart Tools, Design, Layout, and Format are contextual tabs. These tabs are special tabs in the Ribbon that are not visible all the time. They only make an appearance when you are working with a particular slide object which can be edited using special options.
- Within the Chart Tools Layout tab, click the Axis Titles button, as shown highlighted in red within Figure 2, below. Doing so opens the Axis Titles menu, as shown in Figure 2, below.
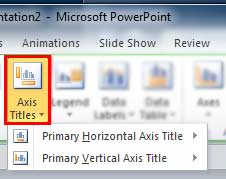
Figure 2: Axis Titles menu - In Figure 2 above, you can see just two options within the Axis Titles menu: Primary Horizontal Axis Title and Primary Vertical Axis Title options. This is because our sample chart includes only two axes. One horizontal and one vertical axis. If your chart includes a depth axis, or any of the secondary axes, you may see more options within Axis Titles menu depending upon the axes included in your chart.
- To add a Horizontal Axis Title to your chart, select the Primary Horizontal Axis Title option within the Axis Titles menu. Doing so opens a sub-menu as shown in Figure 3, below.
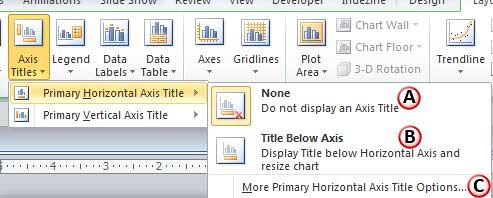
Figure 3: Primary Horizontal Axis Title sub-menu - Note that options in this sub-menu depend upon the option you selected within the Axis Titles menu. Let us explore options within the Primary Horizontal Axis Title sub-menu, as marked in Figure 3, above:
A. None
- This option, which is selected by default, makes sure that there is no Axis Title shown on the chart.
B. Title Below Axis
- Selecting this option adds an Axis Title text box below the Horizontal Axis as shown in Figure 4, below. You can then go ahead and change boilerplate text as required, using the techniques explained in our Selecting and Changing Text in PowerPoint 2010 tutorial.
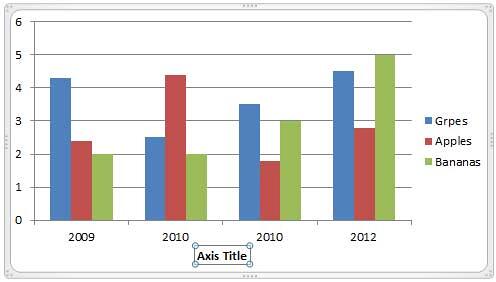
Figure 4: Horizontal Axis Title added Title Locations
- If you select the Secondary Horizontal Axis Title option, you will see the Title Above Axis option rather than the Title Below Axis option. That's because the secondary horizontal axis is an axis that typically shows up above the chart's plot area rather than below.
C. More Primary Horizontal Axis Title Options
- This option summons the Format Axis Title dialog box that you can see in Figure 5, below.
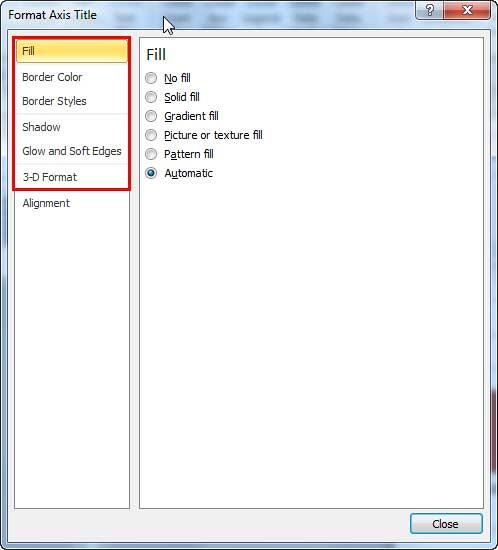
Figure 5: Format Axis Title dialog box - All options other than Alignment, as shown highlighted in red within Figure 5, above work only upon the text container of the axis title, and not upon the actual axis title text. To learn more about these options, refer to our Fills, Lines, and Effects section.
- Alignment, the last option within the sidebar of Format Axis Title dialog box is used to change the direction of the axis title. See Figure 6, below.
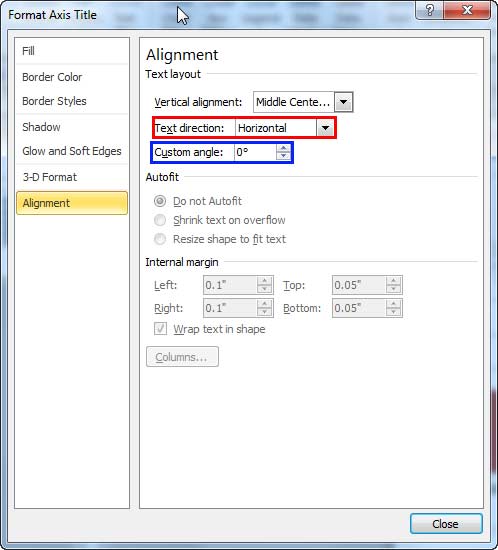
Figure 6: Alignment options within Format Axis Title dialog box - Among options within Alignment, only Text direction and Custom angle options are available for formatting axis titles. The Text direction option as shown highlighted in red within Figure 6, above is used to rotate the axis title by 90 degrees, whereas the Custom angle option as shown highlighted in blue within Figure 6, above is used to rotate the axis title by any degree value you want.
- Now, let us add Vertical Axis Title to our chart. Select the Primary Vertical Axis Title option within the Axis Titles menu. This step opens a sub-menu as shown in Figure 7, below.
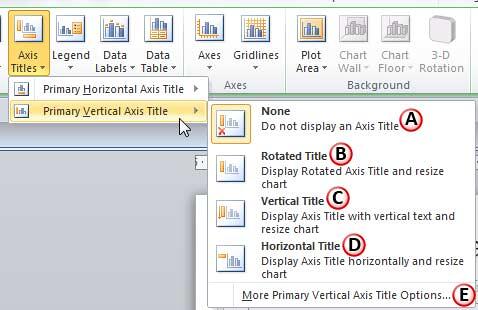
Figure 7: Primary Vertical Axis Title sub-menu - Let us explore options within the Primary Vertical Axis Title sub-menu, as marked in Figure 7, above:
A. None
- This option, which is selected by default, makes sure that there is no Axis Title shown on the chart.
B. Rotated Title
- Adds the placeholder text, Axis Title as the vertical axis title, in front of the Vertical Axis, as shown in Figure 8, below.
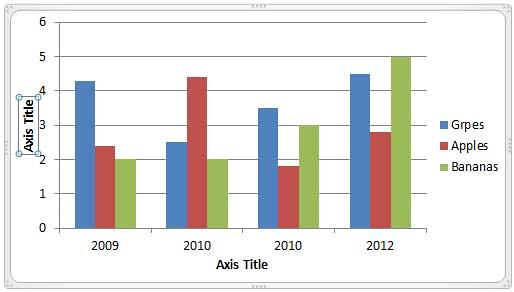
Figure 8: Rotated Axis Title C. Vertical Title
- Adds the placeholder text, Axis Title as the vertical axis title, in front of the Vertical Axis, vertically as shown in Figure 9, below.
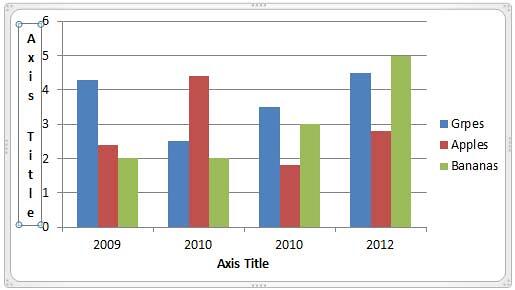
Figure 9: Vertical Axis Title D. Horizontal Title
- Adds the placeholder text, Axis Title as the vertical axis title, in front of the Vertical Axis, horizontally as shown in Figure 10, below.
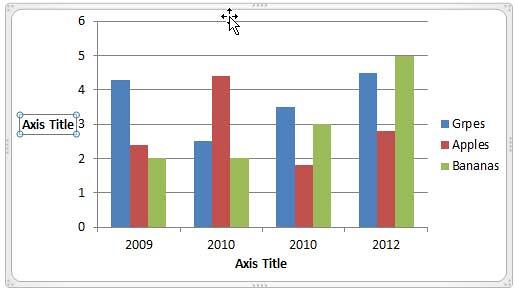
Figure 10: Horizontal Axis Title - As mentioned previously on this page, you can change the placeholder text, Axis Title with a suitable title of your choice using techniques explained in our Selecting and Changing Text in PowerPoint 2010 tutorial.
E. More Primary Vertical Axis Title Options
- Works similar to the More Primary Horizontal Axis Title Options. Please refer to step 3-C on this page for more info.
- Add and edit axis titles as required. If you want to apply some additional text formatting to the axis titles, select them and then select the Format tab of the Ribbon as shown highlighted in red within Figure 11, below.
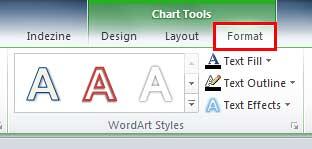
Figure 11: Format tab of the Ribbon selected - Within the Format tab, you can choose any of the Quick Styles for your axis titles. To learn how to apply Quick Styles, refer to our WordArt Styles (Quick Styles) in PowerPoint 2010 tutorial. You can also try some text fills, text outline options and text effects to stylize your axis titles. In Figure 12, you can see our sample chart after axis titles have been added and formatted.
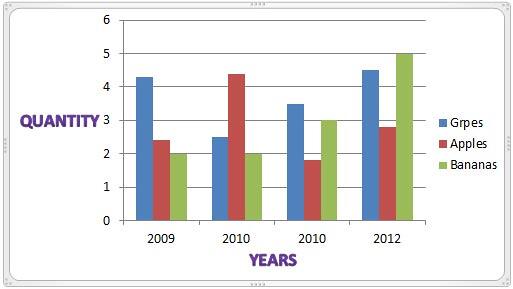
Figure 12: Chart added with Axis Titles - Save your presentation often.


