The Plot Area of a chart, which is transparent by default, can be enhanced with various fill types. However, you should exercise some caution. A busy Plot Area will subdue the actual chart! This can be avoided by taking a little precaution while choosing the fill type and also when you apply it.
In this tutorial, we will explore texture fills for a chart's Plot Area in PowerPoint 2013 for Windows:
- Open your presentation in PowerPoint 2013 for Windows. Select the chart that you want to format the Plot Area for. If you don't have an existing chart, insert a new chart in your slide.
- Now, carefully right-click the Plot Area to bring up a contextual menu as shown in Figure 1, below. In this contextual menu, select the Format Plot Area option (refer to Figure 1 again). If you do not see the Format Plot Area option in the contextual menu, you may have right-clicked on another chart element. Make sure you then deselect anything in the chart, and then right-click on the edge of the Plot Area again.
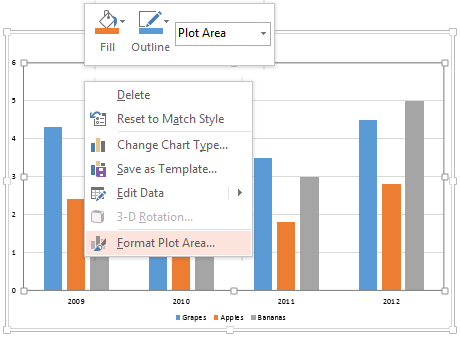
Figure 1: Format Plot Area option - Doing so opens the Format Plot Area Task Pane, as shown in Figure 2, below. In this Task Pane, click the Fill & Line button, highlighted in red within Figure 2 and click the Picture or texture fill radio button, highlighted in blue within Figure 2. This action shows options to choose between a picture or a texture to fill your chart's Plot Area, as shown in Figure 2. Click the Texture button, highlighted in green within Figure 2.
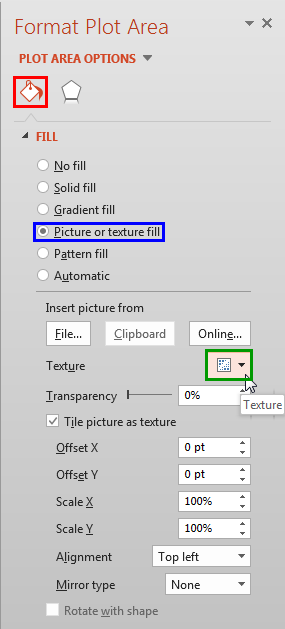
Figure 2: Picture or texture fill option selected - Doing so will bring up the Textures gallery, as shown in Figure 3, below. Within this gallery, you will find 24 different textures which you can choose from. Click on any texture thumbnail to apply as a Chart Plot Area fill. In Figure 3, you can see the texture named Bouquet being selected.
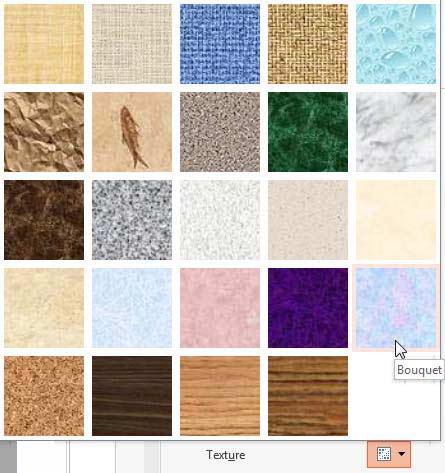
Figure 3: Textures gallery - At this point, you can make some more changes to the texture fill using the other options in the Format Plot Area Task Pane, as explained below:
- If you want to change the transparency of the texture fill, you can use the Transparency slider as shown highlighted in red within Figure 4, below.
- When you use the texture as a fill, the Tile check-box will be selected default, as shown highlighted in blue within Figure 4, below. You can deselect it if you want. Taking this option further, you can also add your own picture as a fill, and then select the Tile check-box to use that picture as a tiled texture.
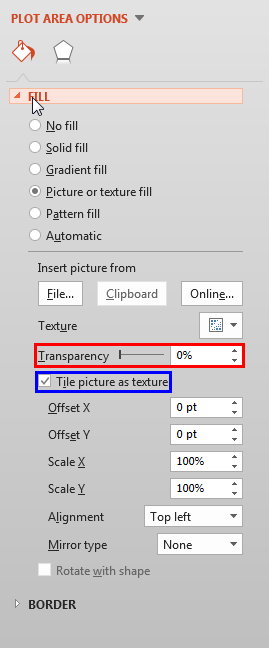
Figure 4: Transparency slider and Tile check-box - When you click on a texture thumbnail, the Plot Area of the Chart is filled with the selected texture, as shown in Figure 5, below.
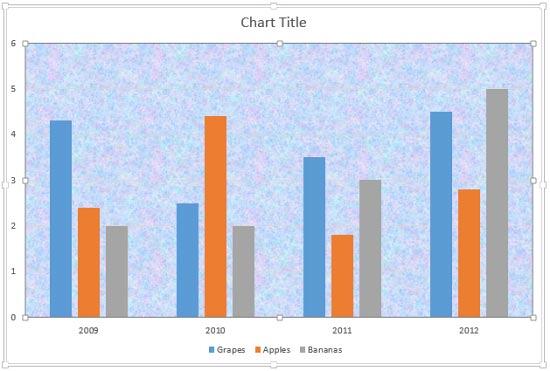
Figure 5: Plot Area applied with a texture fill - Save your presentation often.


