Picture fills can look great and distracting depending upon the type of picture you choose, and the object that you fill with the picture can also make a difference. If you need to use a picture as a fill for your chart's Plot Area, then you must put in plenty of thought because you don't want to crowd your chart. Therefore you can use a picture, but it's best to use one that's muted enough and does not attract too much attention.
Plot Area Fills
Other fill types that you can apply to the Plot Area of a chart include a solid color, a gradient, a texture, or a pattern. Also, you can use a picture fill (explained on this page).
Follow these steps to learn more in PowerPoint 2013 for Windows:
- Select the chart that you want to format the Plot Area for. If you don't have an existing chart, insert a new chart in your slide.
- Now, carefully right-click the Plot Area to bring up a contextual menu as shown in Figure 1. In this contextual menu, select the Format Plot Area option (refer to Figure 1 again). If you do not see the Format Plot Area option in the contextual menu, you may have right-clicked on another chart element. Make sure you then deselect anything in the chart, and then right-click on the edge of the Plot Area.
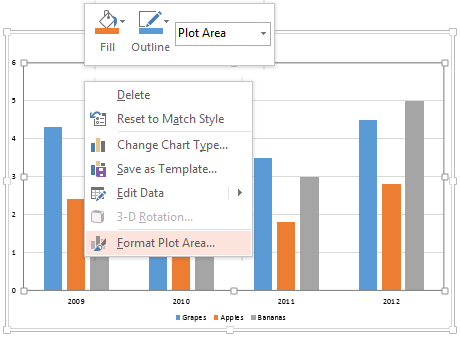
Figure 1: Format Plot Area option - Doing so opens the Format Plot Area Task Pane, as shown in Figure 2. In this Task Pane, click the Fill & Line button, highlighted in red within Figure 2 and click the Picture or texture fill radio button (highlighted in blue within Figure 2). This opens the options where you can choose between a picture or a texture to fill your chart's Plot Area, as shown in Figure 2. Click the File button (highlighted in green within Figure 2).
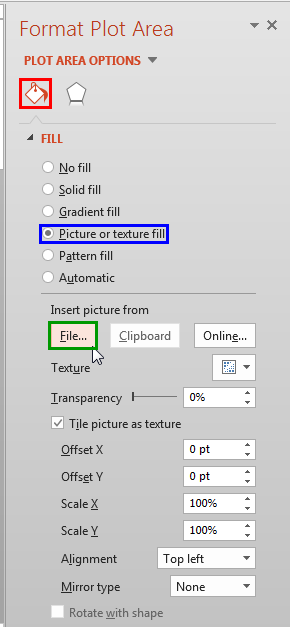
Figure 2: Picture or texture fill option selected - This step will bring up the Insert Picture dialog box as shown in Figure 3. In this dialog box, navigate to the folder where the picture to be used as the fill is located, select it, and click the Insert button, highlighted in red within Figure 3.
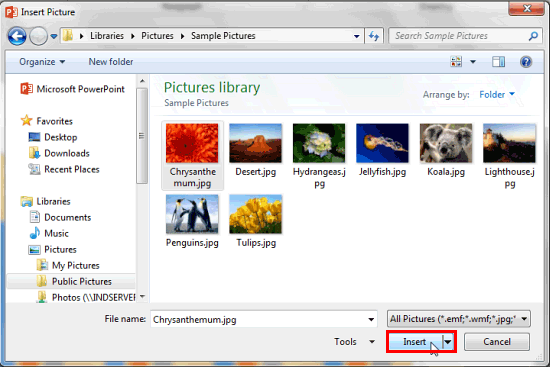
Figure 3: Insert Picture dialog box - Doing so fills the Plot Area of the Chart with the selected picture as shown in Figure 4. Yes, this looks a little crowded, and we will correct it!
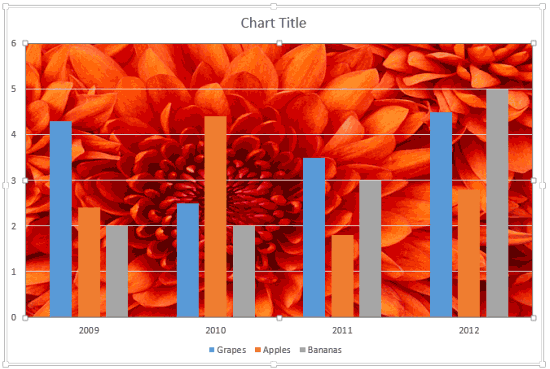
Figure 4: Plot Area applied with a picture fill - At this stage, if you feel that the picture is looking too prominent, you can adjust it's transparency within the Format Plot Area Task Pane to make it look more subtle. In Figure 5, you can see that we have set the transparency of the selected picture fill to 80% (highlighted in red).
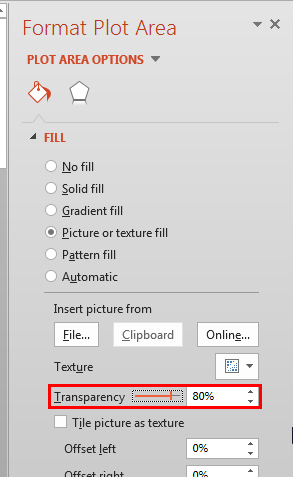
Figure 5: Picture fill's transparency set to 80% - Figure 6, shows our sample chart's Plot Area after we changed the transparency of the picture fill to 80% (compare with the chart shown in Figure 4). Remember that a transparency value of 80% is the same as an opacity value of 20%.
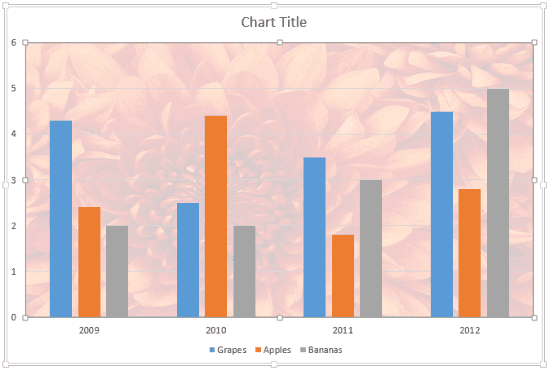
Figure 6: Picture fill with 80% transparency - Save your presentation often.


