Patterns in PowerPoint are two-color designs that include lines, dots, dashes and checks. PowerPoint includes 48 such patterns with names such as 5%, plaid, weaves, shingle, and zigzag. Pattern fills can be particularly pleasing as a fill, especially if you use a simple pattern that comprises two subtle colors. You apply a pattern fill to the Plot Area of a chart in the same way as you would apply a solid color, a gradient, a picture, or a texture fill.
Follow these steps to learn more in PowerPoint 2011 for Mac:
- Select the chart that you want to format the Plot Area for. If you don't have a chart, insert a new chart.
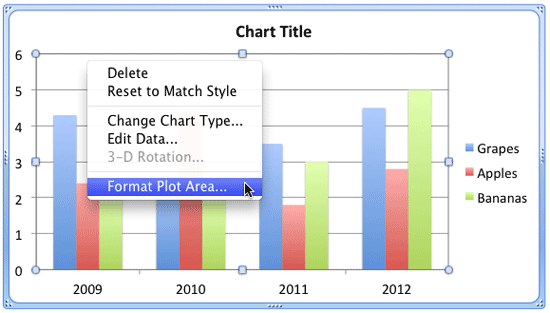
- Now, carefully right-click (or Ctrl+click) the Plot Area. From the resultant menu, select the Format Plot Area option, as shown in Figure 1.

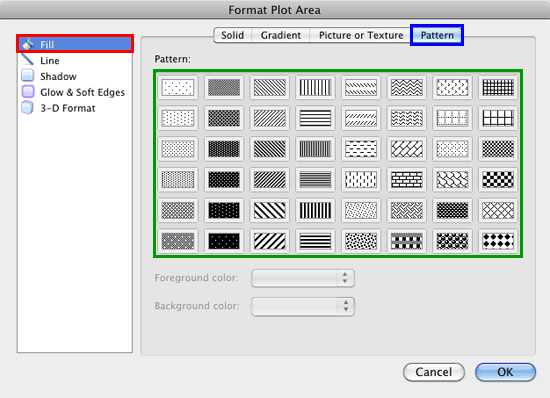
Figure 1: Format Plot Area option - Doing so opens the Format Plot Area dialog box. Make sure that the Fill option is selected within the sidebar (highlighted in red within Figure 2). Then select the Pattern tab (highlighted in blue within Figure 2). This step displays a collection of 48 pattern previews, highlighted in green within Figure 2.

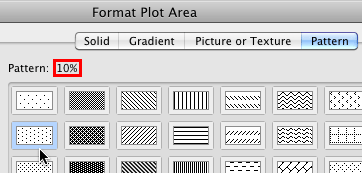
Figure 2: Pattern previews within the Format Plot Area dialog box - If you click on any pattern preview, you will be able to see its name just above the pattern previews group (highlighted in red within Figure 3).

Figure 3: Selected Pattern's name displayed - Click on the pattern of your choice, and you will see a preview of the pattern applied to the Plot Area on the slide. Each pattern comprises two colors, the Foreground color (black by default) and the Background color (white by default). You can also change these colors, click any of the Foreground color or Background color options shown in Figure 4.

Figure 4: Foreground and Background color options - When you click any of these options, Color drop-down gallery appears, as shown in Figure 5.

Figure 5: Color drop-down gallery - Let us explore the options within this Color drop-down gallery as marked in Figure 5:
A. Theme Colors
- Here you can select any of the colors in the active Theme of the presentation. You can also select any of the 5 tints or shades for any Theme color. Learn more about Themes here.
B. Standard Colors
- Here you can choose from any of the ten standard colors. These ten standard colors are just choices of colors that PowerPoint believes to be widely used. You don't have to limit yourself to either the Theme colors or Standard colors, although it's a good design idea to use Theme colors as far as possible.
C. Recent Colors
- Here you can find the colors most recently used. If you have just launched PowerPoint and created a new presentation, the Recent Colors option may be entirely absent since you haven't selected any color recently!
D. More Colors
- This option is to summon the Mac OS X Color picker as shown in Figure 6.

Figure 6: Mac OS X Color picker - In this Color picker, you can choose any color from the wheel. Thereafter adjust the selected color's luminosity within the long, thin slider on the right. Once you are happy with the color attained, you click the OK button to get back to the Format Plot Area dialog box.
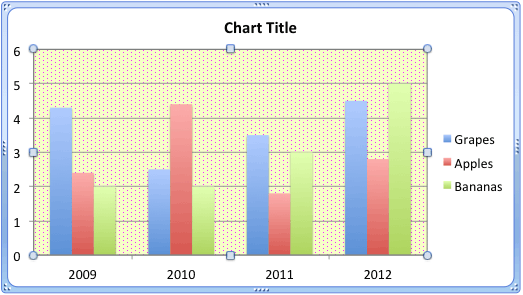
- Select the required pattern and set the Foreground and Background colors within the Format Plot Area dialog box. You can explore other patterns even after selecting the colors. Once done, click the OK button to get back to the slide where you can see the Plot Area filled with the selected pattern, as shown in Figure 7.

Figure 7: Plot Area applied with a pattern fill - Save your presentation often.


