Gradients are typically blended fills between two or more colors. Although most gradients tend to use brighter colors, you can very well use neutral or muted colors. Such a gradient fill can provide a great, understated backdrop for your chart.
In this tutorial, let us learn how to apply a gradient fill to the Plot Area of a chart:
- Open your presentation in PowerPoint 2013 for Windows. Select the chart that you want to format the Plot Area for. If you don't have an existing chart, insert a new chart in your slide.
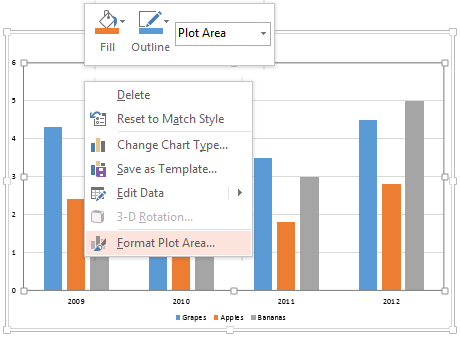
- Now, carefully right-click the Plot Area to bring up a contextual menu as shown in Figure 1, below. In this contextual menu, select the Format Plot Area option (refer to Figure 1 again). If you do not get the Format Plot Area option in the contextual menu, you may have right-clicked on another chart element. Make sure you then deselect anything in the chart, and then right-click on the edge of the Plot Area.

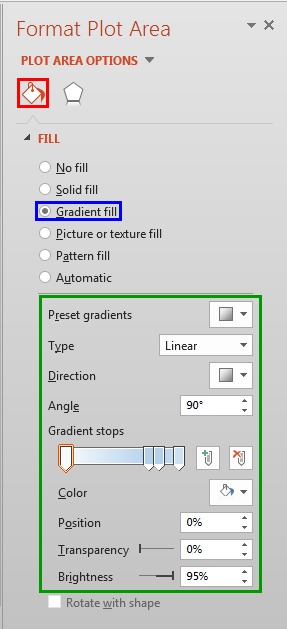
Figure 1: Format Plot Area option - Doing so opens the Format Plot Area Task Pane, as shown in Figure 2, below. In this Task Pane, click the Fill & Line button, highlighted in red within Figure 2, and click the Gradient fill radio button, highlighted in blue within Figure 2. This action applies a gradient fill to the Plot Area of the selected chart, and also opens the gradient editing options within the Format Plot Area Task Pane, as shown highlighted in green within Figure 2.

Figure 2: Gradient fill option selected - All gradient fill options within the Format Plot Area Task Pane work similar to gradient fill options within the Format Shape Task Pane. The only exception is the Rotate with shape option, that is unavailable for the Plot Area since chart elements cannot be rotated. For more info on gradient edit options, refer to points 4-A to 4-E in our More Gradients in PowerPoint 2013 tutorial.
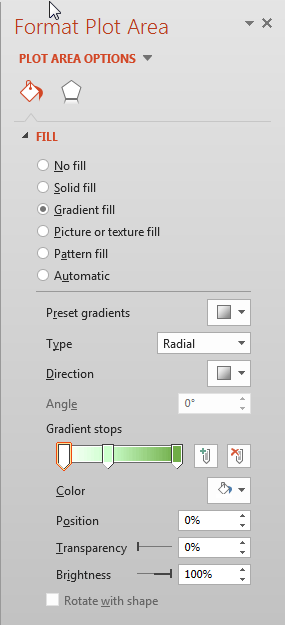
- Select the required gradient edit option from the Format Plot Area Task Pane. In Figure 3,below, you can see the Format Plot Area Task Pane with the gradient setting options we chose for our sample chart's Plot Area. While you make changes, you can see a Live Preview of the changes within the selected chart. After selecting the required options, close the Format Plot Area Task Pane.

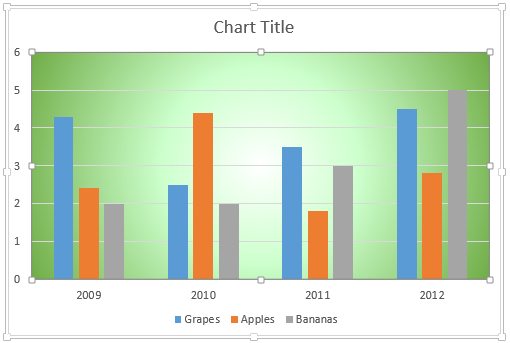
Figure 3: Gradient option set within the Format Plot Area Task Pane - In Figure 4, below, you can see the Plot Area of our sample chart filled with a gradient fill (compare with partially visible chart in Figure 1, below).

Figure 4: Plot Area applied with a gradient fill - Save your presentation often.


