In a chart, the Plot Area is the backdrop upon which other chart elements such as Data Series and Gridlines are placed. This layer has axes on its perimeter. By default, the Plot Area has no fill attributes, and is transparent. This may look plain, and that by itself is no reason to change the fill of the Plot Area. However, there are times when the slide background itself is busy, and adding a different fill to the Plot Area can then make the chart appear more clear.
There are various fills you can apply to the Plot Area, such as a solid color, a gradient, a picture/texture, or a pattern etc. Figure 1 shows variants of the same chart with various fills applied to the Plot Area.
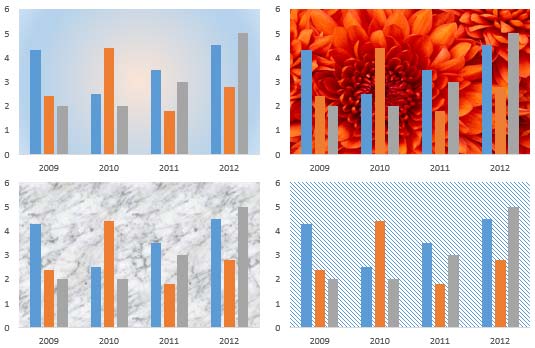
Figure 1: Variants of the same chart with gradient, picture, texture, and pattern fills applied to the Plot Area
Follow these steps to learn how to change the fill of a chart's Plot Area in PowerPoint 2013 for Windows:
- Select the chart that you want to format the Plot Area for. If you don't have an existing chart, insert a new chart in your slide.
- Now, carefully right-click the Plot Area to bring up a contextual menu as shown in Figure 2, below. In this contextual menu, select the Format Plot Area option (refer to Figure 2 again). If you do not get the Format Plot Area option in the contextual menu, you may have right-clicked on another chart element. Make sure you then deselect anything in the chart, and then right-click on the edge of the Plot Area.
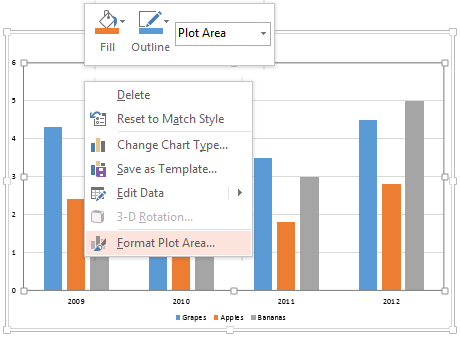
Figure 2: Format Plot Area option - Doing so opens the Format Plot Area Task Pane, as shown in Figure 3, below. Click the Fill & Line button, highlighted in red within Figure 3, below.
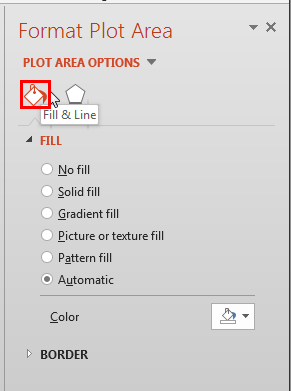
Figure 3: Fill & Line button within the Format Plot Area task pane - Various Fill options available within the Format Plot Area Task Pane for the selected Plot Area are explained below:
No fill
- Removes the fill from the selected Plot Area. There is a detailed tutorial available on No Fill in PowerPoint 2013 for Windows. Although the linked tutorial pertains to shape fills, the concepts are the same, and work for Plot Area fills as well.
Solid fill
- Allows you to select a solid fill color for the Plot Area. Clicking the Color button opens Color drop down gallery, where you can chose from Theme Colors, Standard Colors, etc. as shown in Figure 4, below.
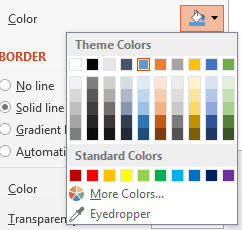
Figure 4: Color drop down gallery - To learn more about this option, refer to our Apply Solid Fills to Plot Area in PowerPoint 2013 for Windows tutorial.
Gradient fill
- You can add graduated fills comprising two or more colors using this option. If you want to know more about how to use this option, our Add Gradient Fills to Plot Area in PowerPoint 2013 for Windows tutorial is just what you need to explore.
Picture or Texture
- A picture or a texture can be used as a fill for the Plot Area using this option. Learn more about this option in our Apply Picture Fills to Plot Area in PowerPoint 2013 for Windows and Apply Texture Fills to Plot Area in PowerPoint 2013 for Windows tutorials.
Pattern
- You can also select from the 48 preset patterns as a fill for the selected Plot Area. To learn more, refer to our Apply Pattern Fills to Plot Area in PowerPoint 2013 for Windows tutorial.
Automatic
- This is the fill type selected by default for the Plot Area.
- Select the required options and format the Plot Area as required. In Figure 5, you can see that the Plot Area of our sample chart is filled with grey color (compare with partially visible chart in Figure 2, shown on this page previously).
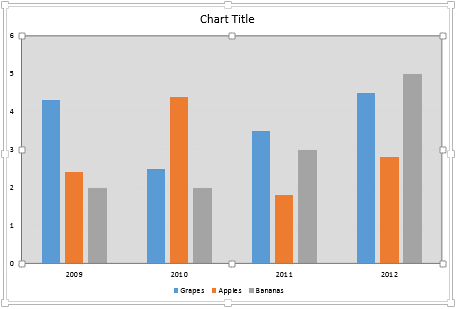
Figure 5: Plot Area filled with grey color - Save your presentation often.


