Learn how you can animate charts in PowerPoint 2010 for Windows. You can animate the entire chart or animate chart categories or series sequentially.
Author: Geetesh Bajaj
Product/Version: PowerPoint 2010 for Windows
OS: Microsoft Windows XP and higher
We have already explored how you can animate any slide object, and then tweak the animation speed and animation events. Although you add animation to a chart in the same way, PowerPoint provides some extra animation options that are applicable only to charts. For example, you can animate series and categories individually as required, and you can also decide whether you want to animate the plot area or not. In this tutorial we'll explore how to apply animation to chart and also explore the various chart animation options in PowerPoint 2010 for Windows.
Like charts, there are extra animation options available for bulleted text and SmartArt.
So, why would you want to animate a chart? Here are some reasons:
Those were just the most common reasons why you would want to animate a chart, there are plenty of other reasons you will discover for yourself! Also remember that animation is movement, and that's something that will attract attention. For that reason, only animate charts that you want to focus on. Animating every single chart in your presentation may be taking the movement part too far!
Scroll down to the bottom of this page to see a sample presentation showing animated charts.
Follow these steps to apply animation to a chart. In this tutorial, we'll use a column chart, but concepts are similar for other chart types:
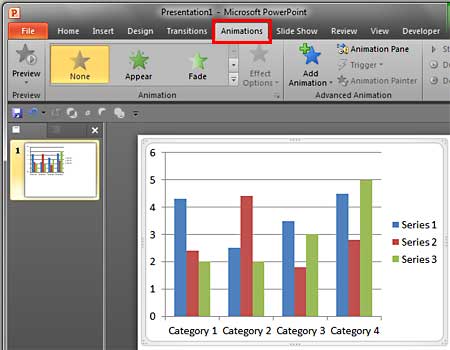
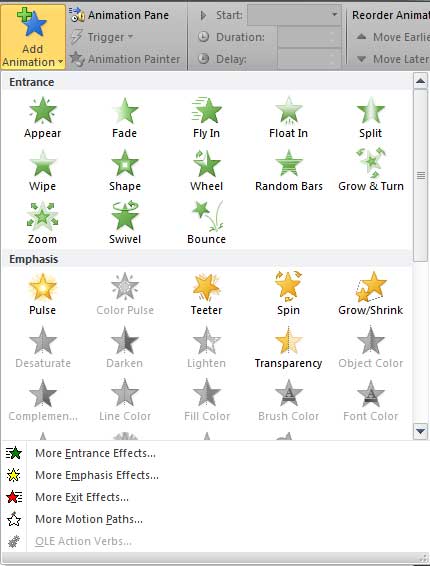
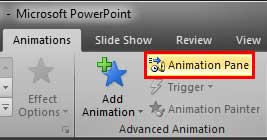
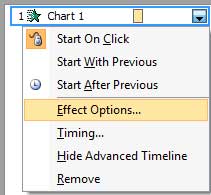
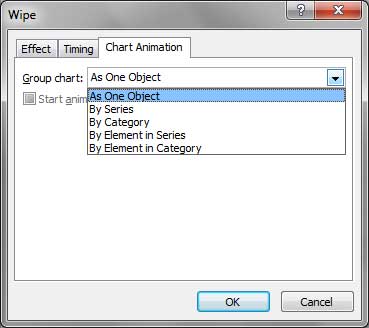
As One Object: Animated all at once.
By Series: All Series are animated one by one.
By Category: All categories are animated one by one.
By Element in Series: All individual series elements are animated sequentially.
By Element in Category: All individual category elements are animated sequentially.
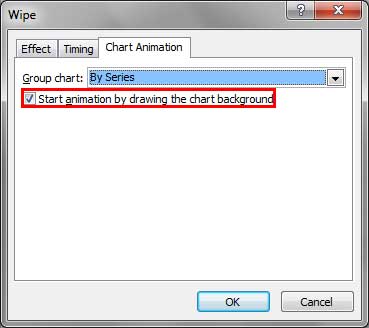
There are no built-in options to animate legends, data labels, or axes separately in PowerPoint. You can only animate categories and series, and the plot area individually.
Sample Presentation
Click below to view on YouTube
See Also:
13 04 03 - Animate Slide Objects: Animate Charts in PowerPoint (Glossary Page)
Animate Charts in PowerPoint 2013 for Windows
Animate Charts in PowerPoint 2011 for Mac
Animate Charts in PowerPoint 2007 for Windows
You May Also Like: The Rules of Netiquette and How To Use Them Both To Communicate Clearly And Save Time | Hands PowerPoint Templates


Microsoft and the Office logo are trademarks or registered trademarks of Microsoft Corporation in the United States and/or other countries.